|
Download Data (XLS File) |
|
||||||||
|
||||||||
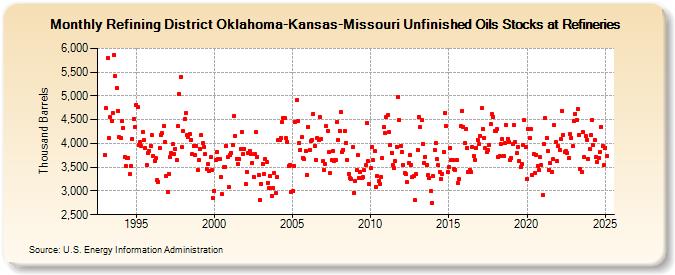
| Refining District Oklahoma-Kansas-Missouri Unfinished Oils Stocks at Refineries (Thousand Barrels) | ||||||||
| Year | Jan | Feb | Mar | Apr | May | Jun | Jul | Aug | Sep | Oct | Nov | Dec |
|---|---|---|---|---|---|---|---|---|---|---|---|---|
| 1993 | 3,752 | 4,740 | 5,799 | 4,111 | 4,554 | 4,481 | 4,644 | 5,870 | 5,413 | 5,172 | 4,691 | 4,130 |
| 1994 | 4,121 | 4,468 | 4,327 | 3,716 | 3,528 | 3,696 | 3,696 | 3,348 | 3,527 | 4,099 | 4,517 | 4,352 |
| 1995 | 4,814 | 4,759 | 3,973 | 4,024 | 3,942 | 4,247 | 4,070 | 3,894 | 3,550 | 3,797 | 3,851 | 3,950 |
| 1996 | 4,169 | 3,731 | 3,640 | 3,686 | 3,234 | 3,198 | 3,894 | 4,186 | 4,211 | 4,371 | 4,034 | 3,312 |
| 1997 | 2,976 | 3,367 | 3,716 | 3,794 | 3,981 | 3,781 | 3,892 | 3,646 | 4,358 | 5,043 | 5,396 | 3,916 |
| 1998 | 4,261 | 4,506 | 4,639 | 4,185 | 4,140 | 4,207 | 4,080 | 3,771 | 3,946 | 3,753 | 3,955 | 3,431 |
| 1999 | 3,660 | 3,881 | 4,176 | 4,000 | 3,932 | 3,772 | 3,468 | 3,557 | 3,427 | 3,704 | 3,431 | 2,847 |
| 2000 | 3,006 | 3,641 | 3,824 | 3,679 | 3,662 | 3,298 | 2,928 | 3,495 | 3,496 | 3,942 | 3,718 | 3,074 |
| 2001 | 3,758 | 3,801 | 3,966 | 4,575 | 4,166 | 3,682 | 3,568 | 3,670 | 3,881 | 4,245 | 3,785 | 3,891 |
| 2002 | 3,146 | 3,401 | 3,802 | 3,851 | 3,774 | 3,597 | 3,297 | 3,773 | 4,232 | 3,719 | 3,328 | 2,812 |
| 2003 | 3,153 | 3,572 | 3,360 | 3,676 | 3,599 | 3,173 | 3,064 | 3,313 | 2,903 | 3,068 | 3,381 | 2,947 |
| 2004 | 3,287 | 4,069 | 4,078 | 4,115 | 4,442 | 4,534 | 4,542 | 4,107 | 4,028 | 3,523 | 3,556 | 2,983 |
| 2005 | 3,003 | 3,530 | 4,461 | 4,906 | 4,469 | 4,017 | 3,871 | 4,126 | 3,702 | 3,672 | 3,842 | 3,343 |
| 2006 | 4,355 | 3,868 | 4,047 | 4,077 | 4,624 | 3,942 | 3,661 | 4,123 | 4,077 | 4,563 | 4,099 | 3,621 |
| 2007 | 3,432 | 3,577 | 4,357 | 4,265 | 3,824 | 3,370 | 3,653 | 3,839 | 3,639 | 3,654 | 4,449 | 4,081 |
| 2008 | 4,260 | 4,659 | 3,812 | 3,867 | 4,259 | 4,012 | 3,659 | 3,354 | 3,266 | 3,248 | 3,918 | 2,963 |
| 2009 | 3,203 | 3,435 | 3,747 | 3,278 | 3,406 | 3,268 | 3,284 | 3,435 | 3,539 | 4,436 | 3,629 | 3,137 |
| 2010 | 3,482 | 3,916 | 3,652 | 3,836 | 3,082 | 3,323 | 3,203 | 3,147 | 3,304 | 3,689 | 4,336 | 4,213 |
| 2011 | 4,563 | 4,591 | 4,243 | 3,969 | 3,804 | 3,545 | 3,476 | 3,621 | 3,932 | 4,978 | 4,497 | 3,948 |
| 2012 | 3,825 | 3,546 | 3,384 | 3,347 | 3,181 | 3,583 | 3,758 | 3,553 | 3,285 | 3,307 | 2,801 | 3,350 |
| 2013 | 3,870 | 4,554 | 4,338 | 4,489 | 3,998 | 3,592 | 3,719 | 3,549 | 3,334 | 3,264 | 2,993 | 2,743 |
| 2014 | 3,323 | 3,862 | 4,003 | 3,663 | 3,536 | 3,389 | 3,261 | 3,359 | 3,827 | 4,637 | 4,363 | 3,399 |
| 2015 | 3,497 | 3,900 | 3,647 | 3,645 | 3,460 | 3,449 | 3,648 | 3,169 | 3,243 | 4,364 | 4,688 | 4,353 |
| 2016 | 4,008 | 4,295 | 3,914 | 3,402 | 3,447 | 3,390 | 3,925 | 3,738 | 3,652 | 3,908 | 4,082 | 3,980 |
| 2017 | 4,159 | 4,738 | 4,300 | 4,119 | 3,896 | 3,813 | 3,855 | 3,977 | 4,399 | 4,613 | 4,565 | 4,266 |
| 2018 | 4,254 | 4,294 | 3,704 | 3,735 | 3,983 | 4,088 | 3,736 | 4,001 | 4,392 | 4,094 | 4,035 | 3,652 |
| 2019 | 3,701 | 3,994 | 4,385 | 4,024 | 3,793 | 3,931 | 3,632 | 3,502 | 3,572 | 3,968 | 4,486 | 3,924 |
| 2020 | 3,256 | 4,309 | 4,123 | 4,294 | 3,343 | 3,774 | 3,385 | 3,764 | 3,530 | 3,435 | 3,704 | 3,543 |
| 2021 | 2,911 | 3,978 | 4,540 | 4,121 | 3,842 | 3,444 | 3,583 | 3,409 | 3,667 | 4,379 | 4,029 | 3,624 |
| 2022 | 3,936 | 3,865 | 4,095 | 4,691 | 4,187 | 3,820 | 3,838 | 3,801 | 3,695 | 4,190 | 4,124 | 3,936 |
| 2023 | 4,455 | 4,629 | 4,494 | 4,723 | 4,183 | 3,464 | 3,399 | 4,236 | 3,713 | 4,161 | 4,078 | 3,675 |
| 2024 | 3,888 | 4,177 | 4,495 | 3,960 | ||||||||
| - = No Data Reported; -- = Not Applicable; NA = Not Available; W = Withheld to avoid disclosure of individual company data. |
| Release Date: 6/28/2024 |
| Next Release Date: 7/31/2024 |