|
Download Data (XLS File) |
|
||||||||
|
||||||||
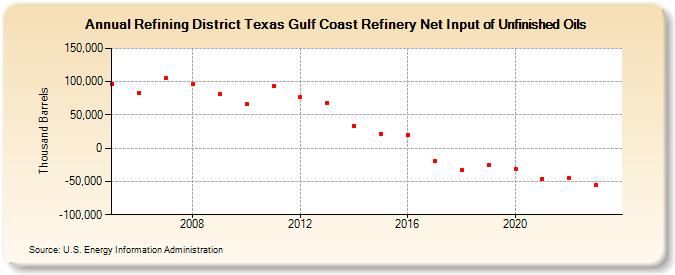
| Refining District Texas Gulf Coast Refinery Net Input of Unfinished Oils (Thousand Barrels) | ||||||||
| Decade | Year-0 | Year-1 | Year-2 | Year-3 | Year-4 | Year-5 | Year-6 | Year-7 | Year-8 | Year-9 |
|---|---|---|---|---|---|---|---|---|---|---|
| 2000's | 97,182 | 83,643 | 105,786 | 96,829 | 81,710 | |||||
| 2010's | 66,380 | 92,798 | 77,003 | 67,952 | 33,265 | 20,990 | 19,677 | -19,611 | -32,671 | -25,314 |
| 2020's | -31,961 | -45,796 | -45,513 | -58,457 |
| - = No Data Reported; -- = Not Applicable; NA = Not Available; W = Withheld to avoid disclosure of individual company data. |
| Release Date: 8/30/2024 |
| Next Release Date: 8/29/2025 |