|
Download Data (XLS File) |
|
||||||||
|
||||||||
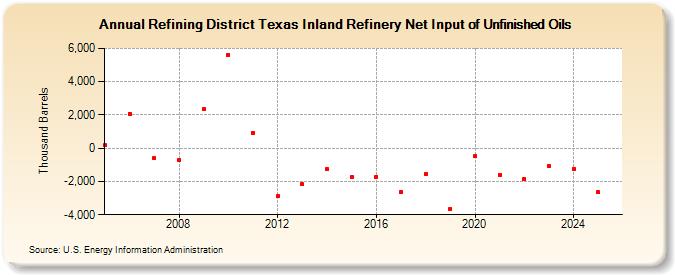
| Refining District Texas Inland Refinery Net Input of Unfinished Oils (Thousand Barrels) | ||||||||
| Decade | Year-0 | Year-1 | Year-2 | Year-3 | Year-4 | Year-5 | Year-6 | Year-7 | Year-8 | Year-9 |
|---|---|---|---|---|---|---|---|---|---|---|
| 2000's | 169 | 2,078 | -612 | -713 | 2,326 | |||||
| 2010's | 5,632 | 931 | -2,897 | -2,165 | -1,266 | -1,719 | -1,731 | -2,633 | -1,540 | -3,648 |
| 2020's | -473 | -1,596 | -1,856 | -1,087 |
| - = No Data Reported; -- = Not Applicable; NA = Not Available; W = Withheld to avoid disclosure of individual company data. |
| Release Date: 3/29/2024 |
| Next Release Date: 8/30/2024 |