|
Download Data (XLS File) |
|
||||||||
|
||||||||
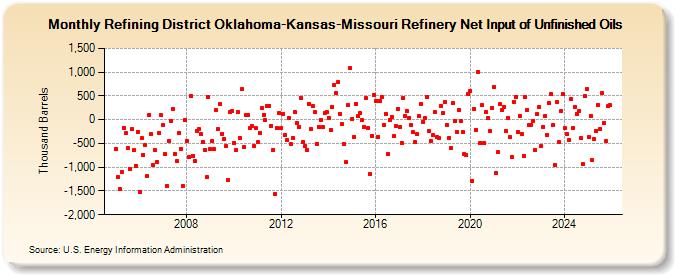
| Refining District Oklahoma-Kansas-Missouri Refinery Net Input of Unfinished Oils (Thousand Barrels) | ||||||||
| Year | Jan | Feb | Mar | Apr | May | Jun | Jul | Aug | Sep | Oct | Nov | Dec |
|---|---|---|---|---|---|---|---|---|---|---|---|---|
| 2005 | -608 | -1,202 | -1,459 | -1,101 | -167 | -289 | -604 | -1,029 | -196 | -647 | -966 | -258 |
| 2006 | -1,513 | -392 | -741 | -538 | -1,183 | 99 | -304 | -957 | -647 | -882 | -278 | 93 |
| 2007 | -113 | -732 | -1,392 | -439 | -35 | 222 | -717 | -879 | -279 | -611 | -1,397 | -17 |
| 2008 | -439 | -789 | 497 | -761 | -878 | -236 | -203 | -306 | -463 | -640 | -1,216 | 475 |
| 2009 | -609 | -447 | -627 | 202 | -202 | 326 | -296 | -403 | -561 | -1,280 | 168 | 181 |
| 2010 | -492 | -641 | 158 | -384 | 644 | -573 | 88 | 91 | -180 | -130 | -556 | -180 |
| 2011 | -479 | -274 | 237 | 108 | -8 | 287 | 297 | -127 | -631 | -1,554 | -177 | 143 |
| 2012 | -179 | 118 | -323 | -435 | 44 | -518 | -377 | 151 | -60 | -146 | 453 | -467 |
| 2013 | -562 | -631 | 334 | -195 | 286 | 154 | -513 | -146 | -2 | -155 | 146 | 151 |
| 2014 | 45 | -213 | 266 | 725 | 556 | 796 | 118 | -98 | -515 | -888 | 304 | 1,083 |
| 2015 | 22 | -355 | 336 | 72 | 134 | -12 | -151 | 457 | -185 | -1,151 | -343 | 525 |
| 2016 | 395 | -355 | 400 | 476 | -107 | 128 | -720 | 3 | 54 | -346 | -128 | 232 |
| 2017 | -156 | -494 | 465 | 80 | 179 | 44 | -112 | -265 | -480 | -310 | 71 | 329 |
| 2018 | -41 | 33 | 485 | -244 | -443 | -333 | 158 | -374 | -386 | 294 | 138 | 365 |
| 2019 | -105 | -381 | -598 | 354 | -33 | -253 | 204 | -33 | -258 | -724 | -734 | 532 |
| 2020 | 607 | -1,281 | 228 | -219 | 1,004 | -488 | 302 | -496 | 161 | 34 | -240 | 254 |
| 2021 | 698 | -1,130 | -683 | 320 | 208 | 270 | -234 | 37 | -373 | -791 | 378 | 479 |
| 2022 | -257 | 84 | -305 | -769 | 474 | 212 | -109 | -111 | -22 | -637 | 118 | 275 |
| 2023 | -539 | -147 | 77 | -313 | 359 | 533 | -119 | -962 | 364 | -473 | 176 | 531 |
| 2024 | -165 | |||||||||||
| - = No Data Reported; -- = Not Applicable; NA = Not Available; W = Withheld to avoid disclosure of individual company data. |
| Release Date: 3/29/2024 |
| Next Release Date: 4/30/2024 |