|
Download Data (XLS File) |
|
||||||||
|
||||||||
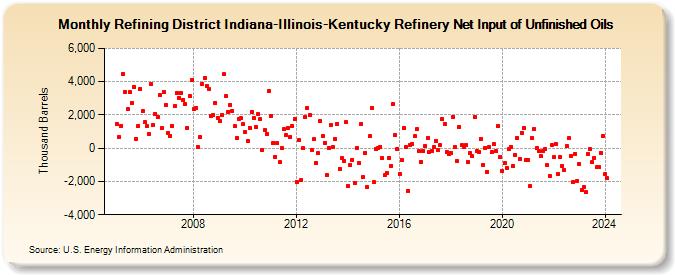
| Refining District Indiana-Illinois-Kentucky Refinery Net Input of Unfinished Oils (Thousand Barrels) | ||||||||
| Year | Jan | Feb | Mar | Apr | May | Jun | Jul | Aug | Sep | Oct | Nov | Dec |
|---|---|---|---|---|---|---|---|---|---|---|---|---|
| 2005 | 1,458 | 685 | 1,351 | 4,456 | 3,391 | 2,327 | 3,374 | 2,728 | 3,706 | 570 | 1,359 | 3,585 |
| 2006 | 2,208 | 1,554 | 1,318 | 826 | 3,845 | 1,386 | 2,074 | 1,891 | 3,182 | 1,241 | 3,377 | 2,599 |
| 2007 | 924 | 755 | 1,344 | 2,508 | 3,306 | 3,033 | 3,314 | 2,916 | 2,631 | 1,233 | 3,127 | 4,084 |
| 2008 | 2,340 | 2,440 | 48 | 658 | 3,883 | 4,225 | 3,751 | 3,549 | 1,923 | 1,992 | 2,718 | 1,843 |
| 2009 | 1,641 | 2,005 | 4,438 | 3,123 | 2,199 | 2,626 | 2,221 | 1,328 | 606 | 1,756 | 1,792 | 1,433 |
| 2010 | 995 | 455 | 1,235 | 2,176 | 1,818 | 1,255 | 2,055 | 1,746 | -84 | 1,088 | 841 | 3,451 |
| 2011 | 1,936 | 324 | -506 | 305 | -844 | 4 | 1,126 | 773 | 1,218 | 684 | 1,321 | 1,749 |
| 2012 | -2,007 | 478 | -1,933 | 4 | 1,848 | 2,430 | 1,967 | -110 | 527 | -890 | -313 | 1,659 |
| 2013 | 725 | 330 | -1,600 | -16 | 1,397 | 43 | 540 | 1,458 | -1,228 | -601 | -748 | 1,558 |
| 2014 | -2,277 | -1,030 | -695 | -2,074 | 13 | -888 | 1,425 | -1,756 | -293 | -2,354 | 703 | 2,430 |
| 2015 | -2,049 | -35 | 28 | 76 | -596 | -1,628 | -1,493 | -571 | -1,048 | 2,630 | 769 | -23 |
| 2016 | -1,530 | -689 | 1,225 | 93 | -2,559 | 192 | 256 | 712 | 1,149 | -187 | -811 | -161 |
| 2017 | 105 | 619 | -247 | -172 | 54 | 436 | -102 | 172 | 1,767 | 1,472 | -201 | -332 |
| 2018 | -260 | 1,900 | 65 | -790 | 1,287 | 162 | 94 | 177 | -849 | -314 | -492 | 1,865 |
| 2019 | -159 | -213 | 580 | -1,007 | 12 | -1,405 | 49 | -223 | 245 | -161 | 1,356 | -515 |
| 2020 | -1,342 | -900 | -1,164 | -72 | 89 | -1,059 | -391 | 599 | -641 | 929 | 1,227 | -681 |
| 2021 | -702 | -2,269 | 624 | 1,157 | -12 | -177 | -499 | -181 | -76 | -1,032 | -1,648 | 202 |
| 2022 | -559 | 237 | -1,550 | -526 | -1,067 | -1,299 | 130 | 591 | -460 | -2,034 | -339 | -1,982 |
| 2023 | -960 | -2,511 | -2,325 | -2,641 | -340 | -77 | -844 | -594 | -1,160 | -1,116 | -283 | 758 |
| 2024 | -1,568 | |||||||||||
| - = No Data Reported; -- = Not Applicable; NA = Not Available; W = Withheld to avoid disclosure of individual company data. |
| Release Date: 3/29/2024 |
| Next Release Date: 4/30/2024 |