|
Download Data (XLS File) |
|
||||||||
|
||||||||
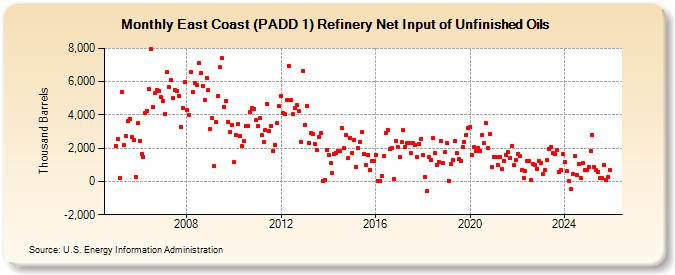
| East Coast (PADD 1) Refinery Net Input of Unfinished Oils (Thousand Barrels) | ||||||||
| Year | Jan | Feb | Mar | Apr | May | Jun | Jul | Aug | Sep | Oct | Nov | Dec |
|---|---|---|---|---|---|---|---|---|---|---|---|---|
| 2005 | 2,158 | 2,550 | 212 | 5,406 | 2,175 | 2,739 | 3,605 | 3,760 | 2,651 | 2,463 | 283 | 3,485 |
| 2006 | 2,425 | 1,637 | 1,467 | 4,102 | 4,252 | 5,557 | 7,968 | 4,462 | 5,294 | 5,519 | 5,463 | 5,052 |
| 2007 | 4,849 | 4,077 | 6,555 | 5,680 | 6,070 | 5,033 | 5,513 | 5,427 | 5,155 | 3,260 | 4,415 | 5,950 |
| 2008 | 4,304 | 3,980 | 6,577 | 5,370 | 5,919 | 5,798 | 7,096 | 6,508 | 5,735 | 4,870 | 6,248 | 5,508 |
| 2009 | 3,125 | 3,797 | 901 | 3,571 | 5,153 | 6,858 | 7,400 | 4,495 | 4,854 | 3,599 | 2,953 | 3,424 |
| 2010 | 1,145 | 2,771 | 3,447 | 2,742 | 2,119 | 2,412 | 3,315 | 3,315 | 4,157 | 4,403 | 4,342 | 3,691 |
| 2011 | 3,316 | 3,789 | 2,785 | 2,345 | 3,085 | 4,635 | 3,025 | 3,328 | 1,809 | 2,215 | 3,505 | 4,517 |
| 2012 | 5,153 | 4,114 | 4,033 | 4,919 | 6,963 | 4,894 | 4,033 | 4,394 | 4,592 | 4,245 | 2,342 | 6,648 |
| 2013 | 3,411 | 4,539 | 2,301 | 2,898 | 2,864 | 2,255 | 1,904 | 2,686 | 2,885 | 37 | 102 | 1,915 |
| 2014 | 1,609 | 1,103 | 490 | 1,648 | 1,696 | 1,849 | 1,807 | 3,210 | 1,982 | 2,780 | 1,382 | 2,610 |
| 2015 | 1,725 | 2,519 | 860 | 1,995 | 2,390 | 2,970 | 1,668 | 980 | 1,620 | 689 | 1,225 | 1,227 |
| 2016 | 1,619 | 49 | 32 | 332 | 1,501 | 2,928 | 3,111 | 1,945 | 1,992 | 133 | 2,425 | 2,071 |
| 2017 | 1,468 | 2,370 | 3,095 | 2,079 | 2,321 | 2,323 | 1,690 | 2,284 | 2,180 | 1,456 | 2,260 | 2,568 |
| 2018 | 1,578 | 273 | -603 | 1,478 | 1,307 | 2,626 | 1,702 | 1,013 | 1,194 | 2,423 | 1,099 | 1,744 |
| 2019 | 2,318 | 37 | 1,057 | 1,266 | 2,424 | 1,684 | 1,328 | 1,242 | 2,072 | 2,376 | 2,817 | 3,217 |
| 2020 | 3,295 | 1,609 | 2,048 | 1,835 | 2,032 | 1,822 | 2,780 | 2,286 | 3,489 | 2,020 | 2,859 | 869 |
| 2021 | 1,464 | 1,458 | 985 | 1,450 | 720 | 1,238 | 1,587 | 1,793 | 1,413 | 2,143 | 968 | 1,313 |
| 2022 | 1,651 | 1,503 | 674 | 222 | 635 | 1,212 | 1,259 | 107 | 1,057 | 965 | 764 | 1,201 |
| 2023 | 1,139 | 436 | 708 | 1,304 | 1,929 | 2,068 | 1,731 | 1,646 | 1,878 | 581 | 673 | 1,625 |
| 2024 | 1,189 | 596 | 34 | -438 | ||||||||
| - = No Data Reported; -- = Not Applicable; NA = Not Available; W = Withheld to avoid disclosure of individual company data. |
| Release Date: 6/28/2024 |
| Next Release Date: 7/31/2024 |
Referring Pages: