|
Download Data (XLS File) |
|
||||||||
|
||||||||
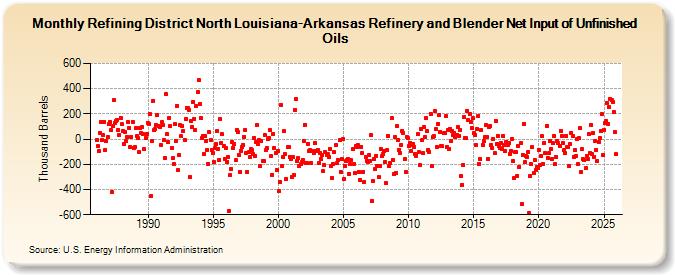
| Refining District North Louisiana-Arkansas Refinery and Blender Net Input of Unfinished Oils (Thousand Barrels) | ||||||||
| Year | Jan | Feb | Mar | Apr | May | Jun | Jul | Aug | Sep | Oct | Nov | Dec |
|---|---|---|---|---|---|---|---|---|---|---|---|---|
| 1986 | -5 | -58 | -95 | 51 | 134 | -6 | 32 | 136 | -88 | -18 | 18 | 119 |
| 1987 | 139 | 69 | -421 | 102 | 308 | 128 | 143 | 155 | 73 | 34 | 170 | 116 |
| 1988 | 63 | -35 | 60 | -18 | 19 | 132 | 90 | -62 | 15 | 139 | -69 | -63 |
| 1989 | 86 | 21 | 7 | -105 | 90 | 48 | 97 | 42 | -77 | 9 | 40 | 131 |
| 1990 | 122 | 196 | -453 | -15 | 303 | 73 | 78 | 112 | 191 | 105 | 96 | -45 |
| 1991 | 132 | 110 | -11 | -150 | 354 | 40 | -22 | 171 | 103 | -70 | -152 | -197 |
| 1992 | 119 | -13 | 265 | -249 | -125 | 108 | 22 | 105 | 63 | -11 | 160 | 247 |
| 1993 | 244 | 234 | -299 | 147 | 98 | 296 | 161 | 74 | 263 | 372 | 467 | 277 |
| 1994 | 166 | 8 | 28 | -118 | 24 | -14 | -84 | -195 | 53 | -7 | -86 | -114 |
| 1995 | -180 | -69 | -39 | 61 | -76 | -162 | 159 | -31 | 38 | -51 | -157 | -73 |
| 1996 | -178 | -144 | -571 | -287 | -237 | -26 | -70 | -40 | -168 | 71 | 53 | -125 |
| 1997 | -263 | -92 | -59 | -46 | 20 | 71 | -110 | -260 | -106 | -141 | -82 | -84 |
| 1998 | -117 | 12 | -132 | -26 | 110 | -40 | -9 | -216 | -12 | -173 | -172 | 33 |
| 1999 | -89 | -68 | 0 | 9 | 72 | -138 | -284 | 40 | -72 | -108 | -243 | -91 |
| 2000 | -412 | -344 | 272 | -215 | -144 | 62 | -120 | -317 | -66 | -63 | -139 | -154 |
| 2001 | -298 | -145 | -285 | 234 | 315 | -170 | -150 | -216 | -201 | -182 | -164 | -13 |
| 2002 | 115 | -189 | -188 | -36 | -94 | -85 | -190 | -95 | -109 | -32 | -92 | -93 |
| 2003 | -86 | -188 | -107 | -159 | -127 | -256 | -206 | -103 | -129 | -117 | -143 | -78 |
| 2004 | -217 | -310 | -201 | -105 | -45 | -190 | -164 | -8 | -258 | -158 | 2 | |
| 2005 | -319 | -214 | -175 | -162 | -158 | -278 | -200 | -168 | -81 | -199 | -272 | -53 |
| 2006 | -65 | -48 | -259 | -324 | -60 | -112 | -258 | -340 | -141 | -171 | -179 | -130 |
| 2007 | -173 | 29 | -491 | -334 | -159 | -238 | -133 | -215 | -304 | -212 | -77 | -138 |
| 2008 | -121 | -97 | -183 | -350 | -85 | 28 | -217 | -191 | 166 | -165 | -278 | 18 |
| 2009 | -269 | 100 | -5 | -83 | -110 | -44 | 65 | 50 | -160 | -261 | 20 | 6 |
| 2010 | -53 | -32 | -93 | -46 | -36 | -59 | -117 | -132 | 38 | -104 | -209 | 82 |
| 2011 | -11 | -113 | 95 | 19 | 168 | 64 | -84 | -100 | 203 | -216 | 13 | 24 |
| 2012 | 220 | 77 | -61 | 122 | 193 | 59 | -55 | -58 | 47 | 45 | 181 | -59 |
| 2013 | 74 | -75 | 84 | -14 | 67 | 31 | 51 | 13 | 35 | 94 | 26 | 72 |
| 2014 | -294 | -362 | -205 | 177 | 12 | 6 | 223 | 152 | 197 | 133 | 90 | 164 |
| 2015 | 48 | 35 | -45 | 77 | 187 | -197 | -161 | 69 | -43 | -16 | 15 | 109 |
| 2016 | 18 | -154 | 98 | 104 | -48 | -69 | 2 | -113 | 147 | -40 | 27 | -57 |
| 2017 | -72 | -31 | -76 | 26 | -46 | -93 | -20 | -47 | -30 | -118 | -91 | 4 |
| 2018 | -174 | -312 | -103 | -106 | -292 | -54 | -220 | -33 | -516 | -124 | 123 | -185 |
| 2019 | -136 | -143 | -103 | -590 | -296 | -196 | -66 | -269 | -164 | -248 | -222 | -232 |
| 2020 | -83 | -207 | -131 | 22 | -197 | -27 | -114 | 102 | -148 | -113 | -18 | -75 |
| 2021 | -155 | -34 | 23 | -201 | -142 | -13 | -31 | -51 | 67 | 25 | -30 | -89 |
| 2022 | -114 | 28 | -66 | -63 | -217 | -39 | 51 | 23 | -139 | -86 | -132 | -1 |
| 2023 | -200 | 5 | 87 | -261 | -82 | -160 | -167 | -233 | -132 | -158 | 46 | -112 |
| 2024 | 91 | -120 | 46 | -139 | ||||||||
| - = No Data Reported; -- = Not Applicable; NA = Not Available; W = Withheld to avoid disclosure of individual company data. |
| Release Date: 6/28/2024 |
| Next Release Date: 7/31/2024 |