|
Download Data (XLS File) |
|
||||||||
|
||||||||
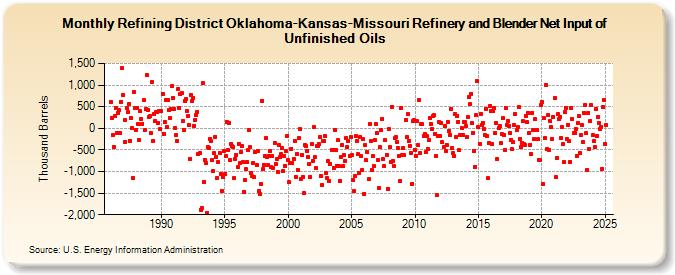
| Refining District Oklahoma-Kansas-Missouri Refinery and Blender Net Input of Unfinished Oils (Thousand Barrels) | ||||||||
| Year | Jan | Feb | Mar | Apr | May | Jun | Jul | Aug | Sep | Oct | Nov | Dec |
|---|---|---|---|---|---|---|---|---|---|---|---|---|
| 1986 | 620 | 242 | -145 | -432 | 280 | 472 | -117 | 355 | 419 | -113 | 616 | 1,388 |
| 1987 | 765 | 189 | -322 | 467 | 366 | 570 | -288 | 247 | -3 | -1,148 | 840 | 468 |
| 1988 | -35 | 472 | 95 | -274 | 394 | 224 | 107 | 645 | -43 | 443 | 1,238 | 423 |
| 1989 | 257 | 280 | -107 | 1,072 | -304 | 337 | 165 | 387 | 372 | 126 | 400 | -22 |
| 1990 | 400 | 791 | -121 | 152 | 664 | 20 | 655 | 419 | 243 | 458 | 973 | 712 |
| 1991 | 447 | 10 | -148 | -293 | 917 | 469 | 797 | 806 | 177 | -37 | 624 | 677 |
| 1992 | 400 | 290 | 80 | -702 | 771 | 621 | 704 | 64 | 199 | 312 | 382 | -596 |
| 1993 | -573 | -1,885 | -1,843 | 1,041 | -1,244 | -729 | -803 | -1,952 | -424 | -459 | -251 | -290 |
| 1994 | -731 | -989 | -574 | -196 | -655 | -1,141 | -783 | -573 | -1,053 | -1,440 | -1,131 | -533 |
| 1995 | -1,057 | -631 | 156 | -504 | 130 | -744 | -352 | -410 | -440 | -1,157 | -707 | -623 |
| 1996 | -905 | -356 | -813 | -542 | -400 | -784 | -1,465 | -1,202 | -953 | -776 | -494 | -34 |
| 1997 | -441 | -1,026 | -1,115 | -797 | -1,131 | -541 | -845 | -529 | -1,462 | -1,521 | -1,282 | 639 |
| 1998 | -944 | -855 | -631 | -230 | -655 | -848 | -631 | -524 | -900 | -641 | -913 | -330 |
| 1999 | -824 | -706 | -1,002 | -398 | -674 | -606 | -465 | -986 | -635 | -865 | -536 | -169 |
| 2000 | -741 | -1,249 | -800 | -471 | -802 | -710 | -285 | -1,119 | -592 | -958 | -232 | -18 |
| 2001 | -1,171 | -607 | -1,124 | -1,501 | -391 | -404 | -518 | -672 | -825 | -1,123 | -358 | -761 |
| 2002 | 27 | -669 | -924 | -420 | -416 | -370 | -201 | -1,094 | -1,310 | -287 | -291 | -180 |
| 2003 | -1,030 | -1,154 | -763 | -1,221 | -825 | -495 | -499 | -908 | -43 | -510 | -863 | -281 |
| 2004 | -867 | -1,211 | -653 | -381 | -875 | -622 | -752 | -222 | -442 | -295 | -645 | -206 |
| 2005 | -608 | -1,202 | -1,459 | -1,101 | -167 | -289 | -604 | -1,029 | -196 | -647 | -966 | -258 |
| 2006 | -1,513 | -392 | -741 | -538 | -1,183 | 99 | -304 | -957 | -647 | -882 | -278 | 93 |
| 2007 | -113 | -732 | -1,392 | -439 | -35 | 222 | -717 | -879 | -279 | -611 | -1,397 | -17 |
| 2008 | -439 | -789 | 497 | -761 | -878 | -236 | -203 | -306 | -463 | -640 | -1,216 | 475 |
| 2009 | -609 | -447 | -627 | 202 | -202 | 326 | -296 | -403 | -561 | -1,280 | 168 | 181 |
| 2010 | -492 | -641 | 158 | -384 | 644 | -573 | 88 | 91 | -180 | -130 | -556 | -180 |
| 2011 | -479 | -274 | 237 | 108 | -8 | 287 | 297 | -127 | -631 | -1,554 | -177 | 143 |
| 2012 | -179 | 118 | -323 | -435 | 44 | -518 | -377 | 151 | -60 | -146 | 453 | -467 |
| 2013 | -562 | -631 | 334 | -195 | 286 | 154 | -513 | -146 | -2 | -155 | 146 | 151 |
| 2014 | 45 | -213 | 266 | 725 | 556 | 796 | 118 | -98 | -515 | -888 | 304 | 1,083 |
| 2015 | 22 | -355 | 336 | 72 | 134 | -12 | -151 | 457 | -185 | -1,151 | -343 | 525 |
| 2016 | 395 | -355 | 400 | 476 | -107 | 128 | -720 | 3 | 54 | -346 | -128 | 232 |
| 2017 | -156 | -494 | 465 | 80 | 179 | 44 | -112 | -265 | -480 | -310 | 71 | 329 |
| 2018 | -41 | 33 | 485 | -244 | -443 | -333 | 158 | -374 | -386 | 294 | 138 | 365 |
| 2019 | -105 | -381 | -598 | 354 | -33 | -253 | 204 | -33 | -258 | -724 | -734 | 532 |
| 2020 | 607 | -1,281 | 228 | -219 | 1,004 | -488 | 302 | -496 | 161 | 34 | -240 | 254 |
| 2021 | 698 | -1,130 | -683 | 320 | 208 | 270 | -234 | 37 | -373 | -791 | 378 | 479 |
| 2022 | -257 | 84 | -305 | -769 | 474 | 212 | -109 | -111 | -22 | -637 | 118 | 275 |
| 2023 | -539 | -147 | 77 | -313 | 359 | 540 | -119 | -962 | 364 | -473 | 176 | 531 |
| 2024 | -165 | |||||||||||
| - = No Data Reported; -- = Not Applicable; NA = Not Available; W = Withheld to avoid disclosure of individual company data. |
| Release Date: 3/29/2024 |
| Next Release Date: 4/30/2024 |