|
Download Data (XLS File) |
|
||||||||
|
||||||||
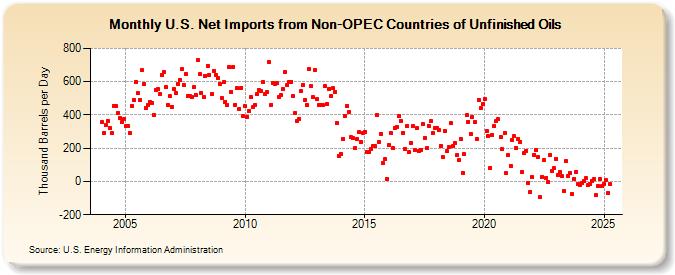
| U.S. Net Imports from Non-OPEC Countries of Unfinished Oils (Thousand Barrels per Day) | ||||||||
| Year | Jan | Feb | Mar | Apr | May | Jun | Jul | Aug | Sep | Oct | Nov | Dec |
|---|---|---|---|---|---|---|---|---|---|---|---|---|
| 2004 | 356 | 294 | 339 | 364 | 320 | 291 | 456 | 453 | 413 | 381 | 356 | 373 |
| 2005 | 331 | 333 | 291 | 456 | 489 | 600 | 530 | 487 | 668 | 586 | 443 | 460 |
| 2006 | 480 | 474 | 400 | 551 | 553 | 526 | 640 | 657 | 567 | 460 | 512 | 450 |
| 2007 | 553 | 532 | 585 | 611 | 674 | 582 | 646 | 516 | 512 | 506 | 566 | 522 |
| 2008 | 728 | 644 | 532 | 507 | 637 | 696 | 641 | 527 | 666 | 643 | 621 | 588 |
| 2009 | 501 | 597 | 480 | 459 | 686 | 539 | 690 | 462 | 559 | 436 | 564 | 393 |
| 2010 | 451 | 388 | 426 | 506 | 449 | 460 | 526 | 550 | 541 | 597 | 523 | 537 |
| 2011 | 716 | 462 | 591 | 586 | 589 | 510 | 517 | 555 | 661 | 578 | 598 | 600 |
| 2012 | 511 | 412 | 363 | 377 | 544 | 580 | 490 | 461 | 675 | 575 | 505 | 668 |
| 2013 | 493 | 460 | 459 | 457 | 572 | 463 | 558 | 513 | 560 | 540 | 351 | 154 |
| 2014 | 165 | 257 | 395 | 456 | 418 | 265 | 259 | 200 | 254 | 296 | 239 | 293 |
| 2015 | 300 | 180 | 175 | 196 | 213 | 214 | 400 | 235 | 287 | 113 | 133 | 16 |
| 2016 | 218 | 289 | 201 | 324 | 328 | 391 | 365 | 294 | 198 | 335 | 175 | 234 |
| 2017 | 333 | 188 | 322 | 182 | 191 | 345 | 262 | 200 | 336 | 361 | 291 | 322 |
| 2018 | 321 | 309 | 214 | 150 | 306 | 181 | 205 | 351 | 212 | 231 | 158 | 126 |
| 2019 | 255 | 53 | 165 | 397 | 360 | 288 | 388 | 355 | 258 | 492 | 440 | 465 |
| 2020 | 497 | 303 | 274 | 83 | 280 | 332 | 365 | 373 | 268 | 194 | 290 | 49 |
| 2021 | 158 | 95 | 248 | 271 | 203 | 255 | 240 | 58 | 171 | 186 | -8 | -61 |
| 2022 | 28 | 162 | 189 | 146 | -96 | 29 | 128 | 23 | -4 | 160 | 63 | 78 |
| 2023 | 142 | 23 | 48 | 7 | -47 | 110 | 47 | 83 | -75 | 1 | 60 | -4 |
| 2024 | -24 | |||||||||||
| - = No Data Reported; -- = Not Applicable; NA = Not Available; W = Withheld to avoid disclosure of individual company data. |
| Release Date: 3/29/2024 |
| Next Release Date: 4/30/2024 |