|
Download Data (XLS File) |
|
||||||||
|
||||||||
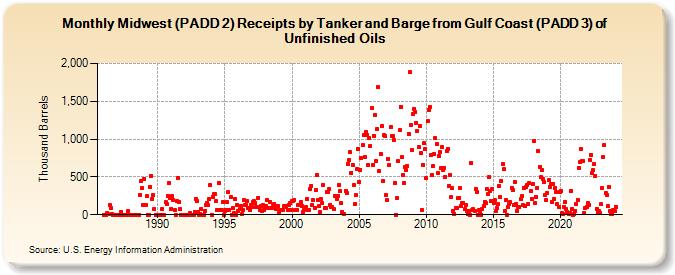
| Midwest (PADD 2) Receipts by Tanker and Barge from Gulf Coast (PADD 3) of Unfinished Oils (Thousand Barrels) | ||||||||
| Year | Jan | Feb | Mar | Apr | May | Jun | Jul | Aug | Sep | Oct | Nov | Dec |
|---|---|---|---|---|---|---|---|---|---|---|---|---|
| 1986 | 0 | 0 | 0 | 19 | 10 | 126 | 93 | 6 | 0 | 0 | 0 | 0 |
| 1987 | 0 | 0 | 0 | 38 | 0 | 0 | 0 | 0 | 0 | 44 | 0 | 0 |
| 1988 | 0 | 0 | 0 | 0 | 0 | 0 | 0 | 0 | 267 | 445 | 351 | 131 |
| 1989 | 472 | 129 | 243 | 0 | 0 | 372 | 517 | 208 | 264 | 73 | 0 | 0 |
| 1990 | 0 | 0 | 0 | 0 | 70 | 0 | 0 | 162 | 139 | 254 | 418 | 222 |
| 1991 | 80 | 241 | 195 | 60 | 0 | 180 | 489 | 171 | 70 | 0 | 0 | 0 |
| 1992 | 0 | 0 | 0 | 0 | 0 | 17 | 0 | 0 | 0 | 39 | 214 | 185 |
| 1993 | 30 | 0 | 16 | 77 | 0 | 0 | 51 | 126 | 160 | 123 | 207 | 387 |
| 1994 | 0 | 239 | 270 | 271 | 176 | 60 | 62 | 421 | 65 | 60 | 170 | 0 |
| 1995 | 53 | 60 | 165 | 298 | 65 | 234 | 0 | 87 | 20 | 208 | 0 | 130 |
| 1996 | 45 | 71 | 118 | 12 | 65 | 190 | 132 | 126 | 177 | 85 | 59 | 123 |
| 1997 | 100 | 166 | 177 | 149 | 102 | 98 | 226 | 59 | 113 | 46 | 123 | 58 |
| 1998 | 89 | 115 | 189 | 91 | 174 | 91 | 88 | 117 | 139 | 119 | 75 | 120 |
| 1999 | 19 | 59 | 59 | 60 | 60 | 109 | 120 | 103 | 61 | 134 | 150 | 62 |
| 2000 | 185 | 187 | 192 | 57 | 61 | 123 | 123 | 132 | 163 | 121 | 38 | 64 |
| 2001 | 103 | 214 | 61 | 63 | 335 | 384 | 135 | 188 | 92 | 322 | 524 | 200 |
| 2002 | 109 | 35 | 205 | 150 | 391 | 90 | 83 | 303 | 297 | 336 | 133 | 103 |
| 2003 | 97 | 73 | 251 | 246 | 208 | 248 | 393 | 308 | 149 | 35 | 13 | |
| 2004 | 318 | 286 | 675 | 726 | 826 | 554 | 662 | 395 | 139 | 255 | 608 | 870 |
| 2005 | 431 | 595 | 753 | 923 | 1,048 | 766 | 1,094 | 1,054 | 663 | 1,008 | 913 | 1,415 |
| 2006 | 662 | 1,047 | 1,318 | 710 | 1,132 | 1,687 | 579 | 803 | 1,175 | 449 | 1,050 | 1,036 |
| 2007 | 259 | 196 | 741 | 651 | 1,157 | 1,043 | 1,038 | 994 | 426 | 0 | 216 | 705 |
| 2008 | 1,119 | 1,431 | 759 | 521 | 422 | 637 | 590 | 643 | 1,072 | 1,885 | 1,192 | 858 |
| 2009 | 1,329 | 1,403 | 1,362 | 1,219 | 1,110 | 894 | 1,175 | 819 | 62 | 660 | 944 | 875 |
| 2010 | 487 | 1,235 | 1,385 | 1,427 | 788 | 522 | 643 | 801 | 1,008 | 937 | 548 | 773 |
| 2011 | 824 | 621 | 891 | 597 | 621 | 503 | 839 | 873 | 385 | 528 | 230 | 347 |
| 2012 | 47 | 10 | 83 | 86 | 217 | 225 | 349 | 111 | 160 | 158 | 71 | 126 |
| 2013 | 43 | 10 | 49 | 0 | 684 | 56 | 69 | 47 | 343 | 302 | 0 | 56 |
| 2014 | 48 | 1 | 82 | 114 | 172 | 150 | 336 | 268 | 501 | 317 | 187 | 341 |
| 2015 | 149 | 188 | 50 | 83 | 142 | 386 | 230 | 442 | 670 | 604 | 55 | 192 |
| 2016 | 0 | 105 | 139 | 162 | 354 | 325 | 125 | 436 | 142 | 55 | 108 | 101 |
| 2017 | 206 | 242 | 123 | 357 | 109 | 360 | 396 | 142 | 416 | 311 | 212 | 404 |
| 2018 | 974 | 149 | 233 | 354 | 842 | 636 | 495 | 590 | 469 | 439 | 262 | 200 |
| 2019 | 286 | 455 | 372 | 400 | 173 | 412 | 213 | 356 | 296 | 141 | 107 | 303 |
| 2020 | 314 | 22 | 10 | 103 | 166 | 72 | 42 | 10 | 25 | 316 | 78 | 0 |
| 2021 | 10 | 50 | 136 | 201 | 623 | 693 | 872 | 705 | 710 | 22 | 85 | 100 |
| 2022 | 160 | 128 | 729 | 792 | 552 | 586 | 670 | 513 | 81 | 35 | 48 | 20 |
| 2023 | 138 | 358 | 761 | 922 | 285 | 255 | 112 | 372 | 52 | 10 | 10 | 61 |
| 2024 | 51 | |||||||||||
| - = No Data Reported; -- = Not Applicable; NA = Not Available; W = Withheld to avoid disclosure of individual company data. |
| Release Date: 3/29/2024 |
| Next Release Date: 4/30/2024 |