|
Download Data (XLS File) |
|
||||||||
|
||||||||
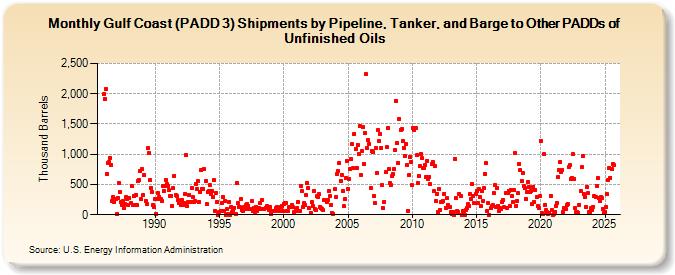
| Gulf Coast (PADD 3) Shipments by Pipeline, Tanker, and Barge to Other PADDs of Unfinished Oils (Thousand Barrels) | ||||||||
| Year | Jan | Feb | Mar | Apr | May | Jun | Jul | Aug | Sep | Oct | Nov | Dec |
|---|---|---|---|---|---|---|---|---|---|---|---|---|
| 1986 | 1,989 | 1,921 | 2,082 | 671 | 863 | 873 | 944 | 824 | 231 | 290 | 204 | 257 |
| 1987 | 9 | 283 | 529 | 377 | 203 | 162 | 234 | 113 | 184 | 291 | 266 | 153 |
| 1988 | 281 | 195 | 468 | 160 | 312 | 162 | 333 | 154 | 551 | 569 | 725 | 256 |
| 1989 | 757 | 323 | 651 | 230 | 184 | 1,097 | 1,013 | 567 | 444 | 379 | 164 | 130 |
| 1990 | 252 | 18 | 267 | 352 | 293 | 253 | 221 | 475 | 395 | 475 | 578 | 506 |
| 1991 | 473 | 401 | 312 | 315 | 151 | 437 | 646 | 323 | 317 | 235 | 187 | 227 |
| 1992 | 162 | 249 | 154 | 187 | 348 | 984 | 139 | 204 | 325 | 206 | 447 | 294 |
| 1993 | 212 | 226 | 505 | 428 | 555 | 213 | 368 | 733 | 430 | 429 | 756 | 555 |
| 1994 | 175 | 380 | 388 | 484 | 345 | 393 | 293 | 572 | 65 | 365 | 213 | 0 |
| 1995 | 53 | 60 | 196 | 298 | 65 | 234 | 0 | 87 | 20 | 208 | 0 | 130 |
| 1996 | 45 | 71 | 118 | 12 | 524 | 190 | 132 | 126 | 260 | 85 | 59 | 123 |
| 1997 | 100 | 166 | 177 | 149 | 102 | 98 | 226 | 59 | 113 | 46 | 123 | 58 |
| 1998 | 89 | 115 | 189 | 91 | 247 | 91 | 88 | 117 | 139 | 119 | 75 | 120 |
| 1999 | 19 | 59 | 59 | 60 | 60 | 109 | 120 | 103 | 61 | 134 | 150 | 62 |
| 2000 | 185 | 187 | 192 | 57 | 61 | 123 | 123 | 132 | 163 | 121 | 38 | 64 |
| 2001 | 103 | 214 | 61 | 63 | 473 | 384 | 135 | 188 | 164 | 322 | 524 | 446 |
| 2002 | 109 | 35 | 205 | 150 | 391 | 90 | 83 | 303 | 297 | 336 | 133 | 103 |
| 2003 | 97 | 73 | 251 | 246 | 208 | 248 | 393 | 308 | 162 | 35 | 13 | |
| 2004 | 428 | 295 | 675 | 726 | 860 | 554 | 662 | 395 | 139 | 255 | 608 | 895 |
| 2005 | 431 | 595 | 753 | 923 | 1,162 | 766 | 1,339 | 1,089 | 778 | 1,157 | 1,003 | 1,465 |
| 2006 | 662 | 1,047 | 1,443 | 842 | 1,359 | 2,320 | 1,098 | 1,233 | 1,175 | 449 | 1,050 | 1,036 |
| 2007 | 309 | 196 | 1,098 | 690 | 1,395 | 1,218 | 1,341 | 1,110 | 489 | 104 | 216 | 705 |
| 2008 | 1,119 | 1,431 | 759 | 521 | 486 | 637 | 670 | 751 | 1,072 | 1,885 | 1,192 | 858 |
| 2009 | 1,584 | 1,403 | 1,412 | 1,219 | 1,110 | 969 | 1,175 | 819 | 62 | 660 | 959 | 875 |
| 2010 | 487 | 1,435 | 1,405 | 1,427 | 979 | 522 | 643 | 801 | 1,008 | 937 | 765 | 773 |
| 2011 | 824 | 621 | 891 | 597 | 621 | 503 | 839 | 873 | 385 | 799 | 230 | 347 |
| 2012 | 47 | 429 | 83 | 218 | 217 | 225 | 349 | 111 | 270 | 158 | 133 | 126 |
| 2013 | 43 | 10 | 49 | 0 | 927 | 275 | 69 | 47 | 343 | 302 | 0 | 56 |
| 2014 | 48 | 1 | 82 | 114 | 172 | 150 | 336 | 268 | 501 | 317 | 187 | 341 |
| 2015 | 397 | 188 | 420 | 301 | 142 | 386 | 230 | 442 | 670 | 852 | 55 | 192 |
| 2016 | 0 | 105 | 139 | 162 | 354 | 486 | 125 | 436 | 142 | 55 | 108 | 101 |
| 2017 | 206 | 242 | 123 | 357 | 109 | 360 | 396 | 142 | 416 | 311 | 212 | 404 |
| 2018 | 1,019 | 149 | 233 | 354 | 842 | 736 | 555 | 690 | 469 | 439 | 262 | 377 |
| 2019 | 548 | 455 | 372 | 400 | 173 | 464 | 213 | 409 | 296 | 141 | 107 | 303 |
| 2020 | 1,223 | 22 | 10 | 997 | 166 | 72 | 42 | 10 | 25 | 316 | 78 | 0 |
| 2021 | 10 | 50 | 136 | 201 | 623 | 733 | 872 | 705 | 739 | 50 | 104 | 100 |
| 2022 | 160 | 178 | 789 | 823 | 586 | 612 | 996 | 596 | 116 | 45 | 48 | 35 |
| 2023 | 168 | 392 | 781 | 967 | 350 | 295 | 133 | 466 | 352 | 46 | 43 | 108 |
| 2024 | 76 | |||||||||||
| - = No Data Reported; -- = Not Applicable; NA = Not Available; W = Withheld to avoid disclosure of individual company data. |
| Release Date: 3/29/2024 |
| Next Release Date: 4/30/2024 |