|
Download Data (XLS File) |
|
||||||||
|
||||||||
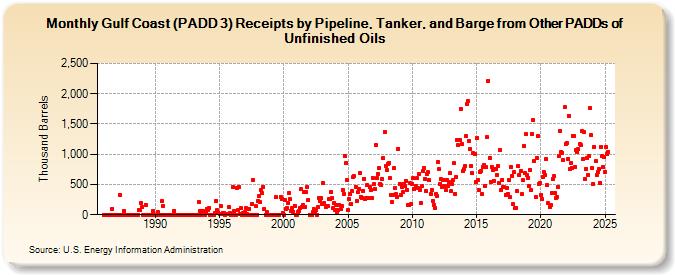
| Gulf Coast (PADD 3) Receipts by Pipeline, Tanker, and Barge from Other PADDs of Unfinished Oils (Thousand Barrels) | ||||||||
| Year | Jan | Feb | Mar | Apr | May | Jun | Jul | Aug | Sep | Oct | Nov | Dec |
|---|---|---|---|---|---|---|---|---|---|---|---|---|
| 1986 | 0 | 0 | 0 | 0 | 0 | 0 | 0 | 0 | 99 | 0 | 0 | 0 |
| 1987 | 0 | 0 | 0 | 327 | 0 | 0 | 0 | 66 | 0 | 0 | 0 | 0 |
| 1988 | 0 | 0 | 0 | 0 | 0 | 0 | 0 | 0 | 0 | 74 | 74 | 200 |
| 1989 | 124 | 0 | 0 | 161 | 0 | 0 | 0 | 0 | 0 | 0 | 62 | 0 |
| 1990 | 0 | 0 | 0 | 37 | 0 | 0 | 219 | 152 | 0 | 0 | 0 | 0 |
| 1991 | 0 | 0 | 0 | 0 | 0 | 0 | 68 | 0 | 0 | 0 | 0 | 0 |
| 1992 | 0 | 0 | 0 | 0 | 0 | 0 | 0 | 0 | 0 | 0 | 0 | 0 |
| 1993 | 0 | 0 | 0 | 0 | 0 | 207 | 68 | 0 | 57 | 61 | 0 | 32 |
| 1994 | 100 | 84 | 105 | 0 | 0 | 0 | 0 | 0 | 32 | 226 | 71 | 40 |
| 1995 | 18 | 140 | 20 | 29 | 30 | 0 | 10 | 16 | 20 | 120 | 27 | 0 |
| 1996 | 0 | 452 | 60 | 0 | 443 | 70 | 451 | 19 | 107 | 0 | 30 | 0 |
| 1997 | 41 | 104 | 12 | 0 | 96 | 0 | 179 | 578 | 0 | 0 | 139 | 0 |
| 1998 | 227 | 305 | 204 | 403 | 354 | 464 | 95 | 0 | 45 | 0 | 0 | 0 |
| 1999 | 0 | 0 | 0 | 0 | 0 | 285 | 0 | 0 | 0 | 295 | 267 | 36 |
| 2000 | 0 | 247 | 99 | 115 | 190 | 367 | 254 | 66 | 110 | 51 | 152 | 0 |
| 2001 | 0 | 49 | 60 | 109 | 424 | 135 | 156 | 380 | 131 | 373 | 453 | 245 |
| 2002 | 0 | 0 | 0 | 37 | 96 | 39 | 70 | 0 | 129 | 279 | 219 | 273 |
| 2003 | 174 | 524 | 189 | 134 | 136 | 147 | 258 | 252 | 370 | 269 | 110 | 192 |
| 2004 | 79 | 153 | 51 | 75 | 167 | 90 | 138 | 412 | 348 | 965 | 851 | 567 |
| 2005 | 73 | 264 | 341 | 177 | 391 | 623 | 635 | 465 | 228 | 371 | 432 | 692 |
| 2006 | 301 | 282 | 394 | 598 | 253 | 274 | 491 | 284 | 457 | 413 | 276 | 613 |
| 2007 | 501 | 429 | 1,152 | 599 | 681 | 770 | 507 | 490 | 598 | 937 | 1,375 | 808 |
| 2008 | 738 | 839 | 852 | 604 | 333 | 212 | 327 | 772 | 440 | 338 | 297 | 1,094 |
| 2009 | 516 | 332 | 463 | 371 | 515 | 481 | 565 | 409 | 154 | 167 | 517 | 174 |
| 2010 | 511 | 602 | 418 | 479 | 602 | 440 | 673 | 415 | 194 | 467 | 718 | 769 |
| 2011 | 593 | 389 | 678 | 700 | 566 | 343 | 412 | 231 | 164 | 114 | 342 | 317 |
| 2012 | 871 | 751 | 508 | 583 | 465 | 578 | 469 | 409 | 576 | 480 | 539 | 682 |
| 2013 | 386 | 510 | 570 | 849 | 350 | 625 | 1,243 | 1,150 | 1,230 | 1,753 | 1,163 | 716 |
| 2014 | 748 | 802 | 1,300 | 1,823 | 1,879 | 1,221 | 1,092 | 805 | 691 | 1,018 | 1,009 | 538 |
| 2015 | 1,275 | 575 | 407 | 711 | 730 | 349 | 794 | 821 | 480 | 781 | 1,277 | 2,216 |
| 2016 | 940 | 541 | 789 | 740 | 563 | 759 | 757 | 662 | 807 | 517 | 1,076 | 408 |
| 2017 | 581 | 460 | 452 | 323 | 434 | 350 | 578 | 290 | 792 | 648 | 170 | 699 |
| 2018 | 116 | 115 | 389 | 805 | 661 | 725 | 336 | 568 | 1,138 | 697 | 1,327 | 650 |
| 2019 | 615 | 471 | 746 | 404 | 1,336 | 1,561 | 888 | 294 | 943 | 1,295 | 505 | 526 |
| 2020 | 332 | 257 | 628 | 701 | 654 | 923 | 485 | 187 | 130 | 164 | 359 | 587 |
| 2021 | 634 | 353 | 277 | 296 | 464 | 976 | 1,381 | 1,044 | 1,028 | 907 | 1,776 | 1,167 |
| 2022 | 1,188 | 929 | 1,639 | 748 | 862 | 777 | 1,306 | 1,303 | 795 | 1,064 | 1,031 | 1,079 |
| 2023 | 1,167 | 1,148 | 1,381 | 913 | 1,330 | 588 | 763 | 937 | 662 | 968 | 1,761 | 1,315 |
| 2024 | 774 | |||||||||||
| - = No Data Reported; -- = Not Applicable; NA = Not Available; W = Withheld to avoid disclosure of individual company data. |
| Release Date: 3/29/2024 |
| Next Release Date: 4/30/2024 |