|
Download Data (XLS File) |
|
||||||||
|
||||||||
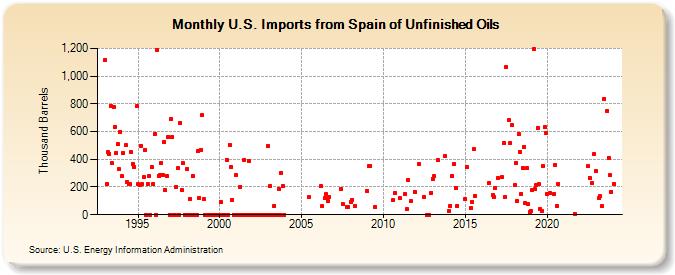
| U.S. Imports from Spain of Unfinished Oils (Thousand Barrels) | ||||||||
| Year | Jan | Feb | Mar | Apr | May | Jun | Jul | Aug | Sep | Oct | Nov | Dec |
|---|---|---|---|---|---|---|---|---|---|---|---|---|
| 1993 | 1,115 | 221 | 449 | 441 | 783 | 372 | 775 | 636 | 447 | 511 | 328 | 598 |
| 1994 | 277 | 442 | 501 | 236 | 218 | 220 | 450 | 366 | 346 | 781 | ||
| 1995 | 219 | 217 | 499 | 220 | 271 | 468 | 0 | 222 | 279 | 0 | 346 | 218 |
| 1996 | 582 | 0 | 1,187 | 282 | 285 | 374 | 285 | 523 | 177 | 280 | 561 | 0 |
| 1997 | 693 | 561 | 0 | 0 | 200 | 335 | 0 | 665 | 177 | 370 | 0 | 0 |
| 1998 | 330 | 0 | 115 | 0 | 280 | 0 | 0 | 0 | 459 | 122 | 470 | 717 |
| 1999 | 110 | 0 | 0 | 0 | 0 | 0 | 0 | 0 | 0 | 0 | 0 | 0 |
| 2000 | 0 | 89 | 0 | 0 | 0 | 398 | 0 | 506 | 347 | 109 | 0 | 0 |
| 2001 | 286 | 0 | 0 | 201 | 0 | 0 | 393 | 0 | 0 | 389 | 0 | 0 |
| 2002 | 0 | 0 | 0 | 0 | 0 | 0 | 0 | 0 | 0 | 0 | 0 | 499 |
| 2003 | 0 | 207 | 0 | 0 | 63 | 0 | 0 | 186 | 0 | 301 | 208 | 0 |
| 2005 | 125 | |||||||||||
| 2006 | 204 | 62 | 120 | 149 | 98 | 131 | ||||||
| 2007 | 182 | 75 | 59 | 56 | ||||||||
| 2008 | 95 | 109 | 62 | |||||||||
| 2009 | 172 | 350 | 350 | 55 | ||||||||
| 2010 | 105 | 156 | ||||||||||
| 2011 | 118 | 149 | 40 | 250 | 100 | 167 | ||||||
| 2012 | 368 | 128 | 1 | 1 | 160 | |||||||
| 2013 | 261 | 277 | 394 | 421 | ||||||||
| 2014 | 25 | 64 | 280 | 367 | 194 | 65 | ||||||
| 2015 | 113 | 347 | 52 | 92 | 472 | 137 | ||||||
| 2016 | 228 | 141 | 125 | 196 | ||||||||
| 2017 | 264 | 270 | 517 | 125 | 1,067 | 682 | 517 | 646 | ||||
| 2018 | 211 | 376 | 96 | 584 | 456 | 149 | 340 | 492 | 83 | 337 | 75 | 18 |
| 2019 | 30 | 180 | 1,194 | 183 | 212 | 628 | 218 | 42 | 27 | 352 | 633 | 591 |
| 2020 | 152 | 158 | 152 | 360 | 65 | 224 | ||||||
| 2021 | 8 | |||||||||||
| 2022 | 348 | 267 | 226 | 435 | ||||||||
| 2023 | 317 | 117 | 132 | 62 | 837 | 750 | 412 | 283 | 166 | |||
| - = No Data Reported; -- = Not Applicable; NA = Not Available; W = Withheld to avoid disclosure of individual company data. |
| Release Date: 3/29/2024 |
| Next Release Date: 4/30/2024 |