|
Download Data (XLS File) |
|
||||||||
|
||||||||
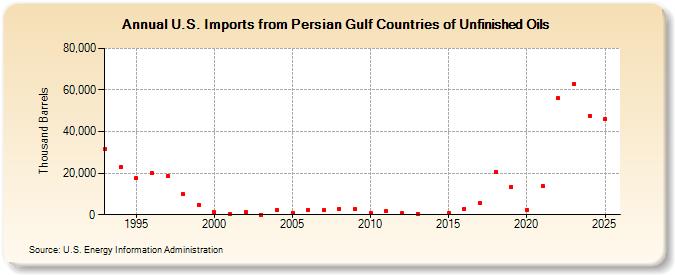
| U.S. Imports from Persian Gulf Countries of Unfinished Oils (Thousand Barrels) | ||||||||
| Decade | Year-0 | Year-1 | Year-2 | Year-3 | Year-4 | Year-5 | Year-6 | Year-7 | Year-8 | Year-9 |
|---|---|---|---|---|---|---|---|---|---|---|
| 1990's | 31,652 | 22,902 | 17,628 | 19,974 | 18,414 | 9,901 | 4,731 | |||
| 2000's | 1,094 | 239 | 1,088 | 66 | 2,233 | 1,059 | 2,150 | 2,044 | 2,954 | 2,718 |
| 2010's | 884 | 1,551 | 695 | 498 | 593 | 2,951 | 5,608 | 20,718 | 13,436 | |
| 2020's | 2,386 | 13,699 | 55,986 | 63,024 |
| - = No Data Reported; -- = Not Applicable; NA = Not Available; W = Withheld to avoid disclosure of individual company data. |
| Release Date: 3/29/2024 |
| Next Release Date: 8/30/2024 |