|
Download Data (XLS File) |
|
||||||||
|
||||||||
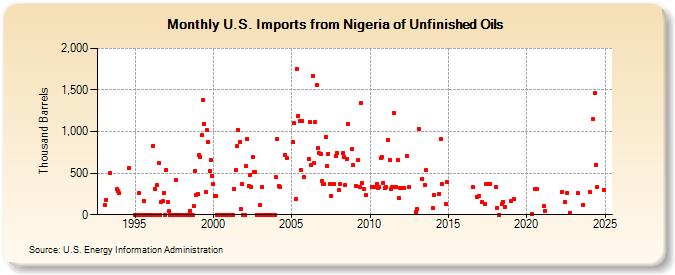
| U.S. Imports from Nigeria of Unfinished Oils (Thousand Barrels) | ||||||||
| Year | Jan | Feb | Mar | Apr | May | Jun | Jul | Aug | Sep | Oct | Nov | Dec |
|---|---|---|---|---|---|---|---|---|---|---|---|---|
| 1993 | 113 | 182 | 500 | 305 | 281 | |||||||
| 1994 | 257 | 560 | ||||||||||
| 1995 | 0 | 0 | 0 | 261 | 0 | 0 | 0 | 163 | 0 | 0 | 0 | 0 |
| 1996 | 0 | 0 | 827 | 305 | 0 | 352 | 623 | 0 | 151 | 160 | 266 | 0 |
| 1997 | 541 | 155 | 41 | 0 | 0 | 0 | 0 | 423 | 0 | 0 | 0 | 0 |
| 1998 | 0 | 0 | 0 | 0 | 0 | 0 | 50 | 0 | 0 | 100 | 531 | 240 |
| 1999 | 255 | 718 | 694 | 955 | 1,379 | 1,090 | 272 | 1,017 | 877 | 523 | 658 | 463 |
| 2000 | 371 | 224 | 222 | 0 | 0 | 0 | 0 | 0 | 0 | 0 | 0 | 0 |
| 2001 | 0 | 0 | 0 | 0 | 314 | 535 | 823 | 1,019 | 870 | 70 | 372 | 0 |
| 2002 | 0 | 582 | 912 | 348 | 472 | 338 | 695 | 516 | 516 | 0 | 0 | 0 |
| 2003 | 116 | 334 | 0 | 0 | 0 | 0 | 0 | 0 | 0 | 0 | 0 | 0 |
| 2004 | 451 | 912 | 345 | 334 | 722 | 676 | ||||||
| 2005 | 870 | 1,098 | 189 | 1,758 | 1,188 | 1,123 | 538 | 1,131 | 456 | |||
| 2006 | 664 | 1,120 | 594 | 1,671 | 622 | 1,109 | 1,559 | 807 | 742 | 734 | 405 | |
| 2007 | 364 | 367 | 939 | 583 | 734 | 372 | 229 | 365 | 701 | 741 | ||
| 2008 | 300 | 367 | 737 | 692 | 360 | 669 | 1,085 | 787 | 595 | |||
| 2009 | 349 | 659 | 332 | 1,343 | 381 | 311 | 234 | |||||
| 2010 | 336 | 333 | 365 | 326 | 332 | 677 | 698 | 385 | 326 | |||
| 2011 | 335 | 896 | 658 | 307 | 331 | 1,227 | 334 | 335 | 662 | 196 | 319 | |
| 2012 | 323 | 325 | 708 | 328 | 33 | |||||||
| 2013 | 67 | 1,036 | 433 | 360 | 533 | |||||||
| 2014 | 82 | 236 | 252 | 905 | 371 | 126 | 397 | |||||
| 2016 | 329 | 216 | 227 | |||||||||
| 2017 | 150 | 130 | 366 | 364 | 369 | |||||||
| 2018 | 336 | 86 | 1 | 125 | 157 | 98 | ||||||
| 2019 | 166 | 194 | ||||||||||
| 2020 | 3 | 306 | 306 | |||||||||
| 2021 | 101 | 50 | ||||||||||
| 2022 | 277 | 151 | 263 | 26 | ||||||||
| 2023 | 257 | 120 | ||||||||||
| 2024 | 275 | |||||||||||
| - = No Data Reported; -- = Not Applicable; NA = Not Available; W = Withheld to avoid disclosure of individual company data. |
| Release Date: 3/29/2024 |
| Next Release Date: 4/30/2024 |