|
Download Data (XLS File) |
|
||||||||
|
||||||||
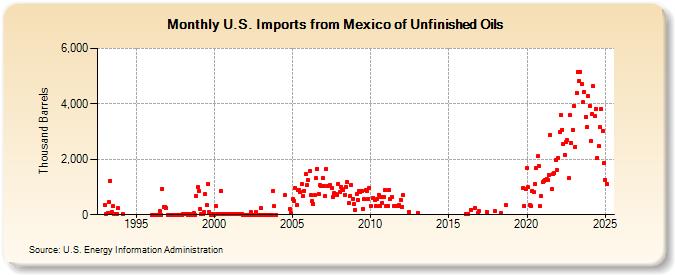
| U.S. Imports from Mexico of Unfinished Oils (Thousand Barrels) | ||||||||
| Year | Jan | Feb | Mar | Apr | May | Jun | Jul | Aug | Sep | Oct | Nov | Dec |
|---|---|---|---|---|---|---|---|---|---|---|---|---|
| 1993 | 350 | 31 | 44 | 461 | 1,220 | 114 | 302 | 34 | 16 | 34 | 233 | |
| 1994 | 18 | |||||||||||
| 1996 | 0 | 0 | 0 | 0 | 0 | 0 | 132 | 0 | 945 | 288 | 288 | 243 |
| 1997 | 0 | 0 | 0 | 0 | 0 | 0 | 0 | 0 | 0 | 0 | 0 | 0 |
| 1998 | 32 | 32 | 32 | 33 | 0 | 31 | 0 | 0 | 50 | 0 | 693 | 984 |
| 1999 | 863 | 212 | 36 | 43 | 83 | 739 | 350 | 1,095 | 80 | 0 | 40 | 42 |
| 2000 | 0 | 311 | 32 | 32 | 43 | 847 | 32 | 35 | 32 | 30 | 34 | 25 |
| 2001 | 37 | 32 | 36 | 37 | 32 | 32 | 32 | 32 | 33 | 37 | 0 | 0 |
| 2002 | 0 | 0 | 0 | 0 | 80 | 0 | 0 | 0 | 87 | 0 | 0 | 0 |
| 2003 | 231 | 0 | 0 | 0 | 0 | 0 | 0 | 0 | 0 | 869 | 300 | 0 |
| 2004 | 700 | 219 | 50 | |||||||||
| 2005 | 555 | 512 | 981 | 339 | 891 | 899 | 813 | 1,112 | 672 | 868 | 1,465 | 1,077 |
| 2006 | 1,250 | 1,582 | 699 | 486 | 399 | 694 | 1,314 | 1,663 | 764 | 1,070 | 1,019 | 1,319 |
| 2007 | 1,035 | 682 | 1,653 | 1,051 | 1,020 | 1,063 | 975 | 622 | 775 | 743 | 699 | 1,121 |
| 2008 | 806 | 1,006 | 925 | 877 | 722 | 1,014 | 1,172 | 418 | 668 | 1,078 | 584 | 394 |
| 2009 | 170 | 751 | 531 | 853 | 808 | 855 | 224 | 552 | 881 | 838 | 576 | 961 |
| 2010 | 317 | 619 | 543 | 319 | 580 | 723 | 315 | 633 | 439 | 652 | 895 | |
| 2011 | 319 | 315 | 908 | 584 | 637 | 317 | 300 | 315 | 345 | 541 | ||
| 2012 | 273 | 699 | 99 | |||||||||
| 2013 | 75 | |||||||||||
| 2016 | 36 | 36 | 180 | 245 | 65 | 125 | ||||||
| 2017 | 109 | 123 | ||||||||||
| 2018 | 60 | 338 | ||||||||||
| 2019 | 967 | 330 | 925 | |||||||||
| 2020 | 1,695 | 985 | 344 | 314 | 851 | 806 | 1,107 | 1,679 | 2,106 | 1,756 | 301 | 662 |
| 2021 | 1,179 | 1,233 | 1,248 | 1,280 | 1,267 | 1,435 | 2,875 | 941 | 1,476 | 1,489 | 1,961 | 1,615 |
| 2022 | 2,050 | 2,969 | 3,595 | 3,074 | 2,535 | 2,168 | 2,607 | 2,681 | 1,308 | 3,592 | 2,580 | 3,074 |
| 2023 | 3,926 | 2,458 | 4,403 | 5,155 | 4,817 | 5,159 | 4,718 | 4,050 | 4,435 | 3,527 | 3,153 | 4,265 |
| 2024 | 3,933 | |||||||||||
| - = No Data Reported; -- = Not Applicable; NA = Not Available; W = Withheld to avoid disclosure of individual company data. |
| Release Date: 3/29/2024 |
| Next Release Date: 4/30/2024 |