|
Download Data (XLS File) |
|
||||||||
|
||||||||
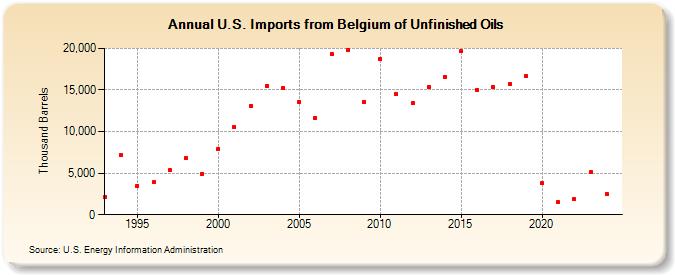
| U.S. Imports from Belgium of Unfinished Oils (Thousand Barrels) | ||||||||
| Decade | Year-0 | Year-1 | Year-2 | Year-3 | Year-4 | Year-5 | Year-6 | Year-7 | Year-8 | Year-9 |
|---|---|---|---|---|---|---|---|---|---|---|
| 1990's | 2,108 | 7,194 | 3,491 | 3,876 | 5,337 | 6,814 | 4,938 | |||
| 2000's | 7,957 | 10,574 | 13,107 | 15,490 | 15,258 | 13,576 | 11,675 | 19,381 | 19,845 | 13,577 |
| 2010's | 18,714 | 14,539 | 13,395 | 15,341 | 16,617 | 19,645 | 14,997 | 15,339 | 15,745 | 16,663 |
| 2020's | 3,781 | 1,498 | 1,837 | 5,102 |
| - = No Data Reported; -- = Not Applicable; NA = Not Available; W = Withheld to avoid disclosure of individual company data. |
| Release Date: 3/29/2024 |
| Next Release Date: 8/30/2024 |