|
Download Data (XLS File) |
|
||||||||
|
||||||||
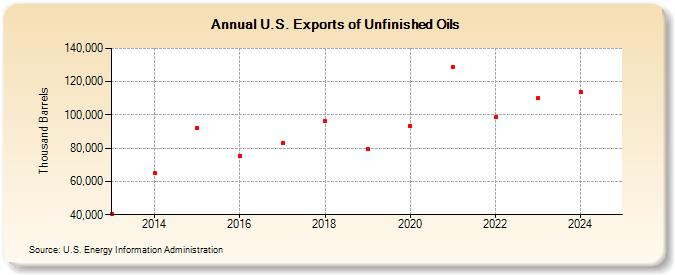
| U.S. Exports of Unfinished Oils (Thousand Barrels) | ||||||||
| Decade | Year-0 | Year-1 | Year-2 | Year-3 | Year-4 | Year-5 | Year-6 | Year-7 | Year-8 | Year-9 |
|---|---|---|---|---|---|---|---|---|---|---|
| 1990's | 0 | 0 | ||||||||
| 2010's | 40,591 | 64,922 | 92,101 | 75,342 | 82,949 | 96,127 | 79,228 | |||
| 2020's | 93,589 | 128,764 | 98,458 | 110,093 |
| - = No Data Reported; -- = Not Applicable; NA = Not Available; W = Withheld to avoid disclosure of individual company data. |
| Release Date: 3/29/2024 |
| Next Release Date: 8/30/2024 |