|
Download Data (XLS File) |
|
||||||||
|
||||||||
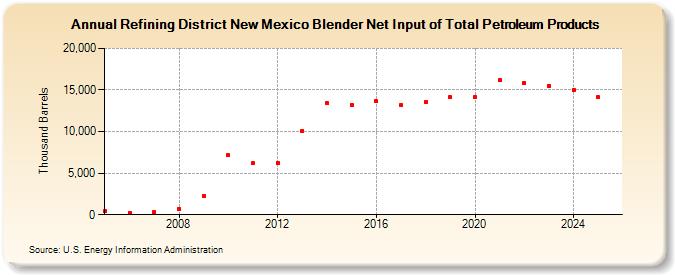
| Refining District New Mexico Blender Net Input of Total Petroleum Products (Thousand Barrels) | ||||||||
| Decade | Year-0 | Year-1 | Year-2 | Year-3 | Year-4 | Year-5 | Year-6 | Year-7 | Year-8 | Year-9 |
|---|---|---|---|---|---|---|---|---|---|---|
| 2000's | 398 | 246 | 282 | 702 | 2,267 | |||||
| 2010's | 7,144 | 6,159 | 6,231 | 10,111 | 13,402 | 13,250 | 13,627 | 13,168 | 13,556 | 14,134 |
| 2020's | 14,135 | 16,162 | 15,848 | 15,592 |
| - = No Data Reported; -- = Not Applicable; NA = Not Available; W = Withheld to avoid disclosure of individual company data. |
| Release Date: 6/28/2024 |
| Next Release Date: 8/30/2024 |