|
Download Data (XLS File) |
|
||||||||
|
||||||||
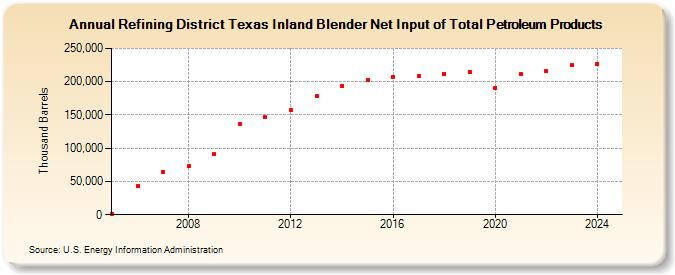
| Refining District Texas Inland Blender Net Input of Total Petroleum Products (Thousand Barrels) | ||||||||
| Decade | Year-0 | Year-1 | Year-2 | Year-3 | Year-4 | Year-5 | Year-6 | Year-7 | Year-8 | Year-9 |
|---|---|---|---|---|---|---|---|---|---|---|
| 2000's | 1,080 | 43,436 | 64,566 | 72,998 | 90,708 | |||||
| 2010's | 136,216 | 146,420 | 156,909 | 178,243 | 194,195 | 203,171 | 207,047 | 208,146 | 212,117 | 214,905 |
| 2020's | 191,138 | 210,759 | 215,269 | 224,677 | 226,306 |
| - = No Data Reported; -- = Not Applicable; NA = Not Available; W = Withheld to avoid disclosure of individual company data. |
| Release Date: 6/30/2025 |
| Next Release Date: 8/29/2025 |