|
Download Data (XLS File) |
|
||||||||
|
||||||||
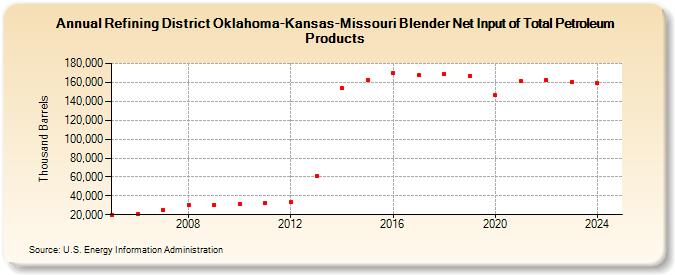
| Refining District Oklahoma-Kansas-Missouri Blender Net Input of Total Petroleum Products (Thousand Barrels) | ||||||||
| Decade | Year-0 | Year-1 | Year-2 | Year-3 | Year-4 | Year-5 | Year-6 | Year-7 | Year-8 | Year-9 |
|---|---|---|---|---|---|---|---|---|---|---|
| 2000's | 20,032 | 20,493 | 25,370 | 30,239 | 30,226 | |||||
| 2010's | 31,194 | 32,837 | 33,299 | 61,168 | 153,610 | 162,965 | 169,830 | 167,768 | 169,096 | 167,044 |
| 2020's | 146,356 | 161,202 | 162,405 | 160,266 |
| - = No Data Reported; -- = Not Applicable; NA = Not Available; W = Withheld to avoid disclosure of individual company data. |
| Release Date: 3/29/2024 |
| Next Release Date: 8/30/2024 |