|
Download Data (XLS File) |
|
||||||||
|
||||||||
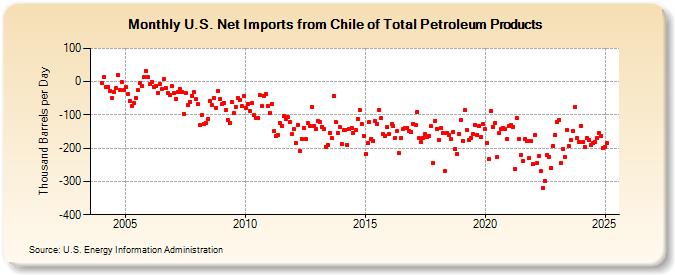
| U.S. Net Imports from Chile of Total Petroleum Products (Thousand Barrels per Day) | ||||||||
| Year | Jan | Feb | Mar | Apr | May | Jun | Jul | Aug | Sep | Oct | Nov | Dec |
|---|---|---|---|---|---|---|---|---|---|---|---|---|
| 2004 | -5 | 15 | -17 | -17 | -29 | -48 | -30 | -20 | 21 | -25 | 0 | -26 |
| 2005 | -16 | -37 | -57 | -72 | -64 | -49 | -26 | -4 | -13 | 14 | 33 | 14 |
| 2006 | -8 | 0 | -15 | -14 | -33 | -8 | -23 | 7 | -19 | -34 | -39 | -14 |
| 2007 | -34 | -52 | -30 | -22 | -30 | -96 | -34 | -70 | -60 | -42 | -32 | -53 |
| 2008 | -67 | -131 | -100 | -128 | -125 | -113 | -59 | -70 | -49 | -78 | -28 | -53 |
| 2009 | -68 | -63 | -84 | -114 | -124 | -61 | -95 | -75 | -48 | -54 | -74 | -44 |
| 2010 | -78 | -66 | -87 | -65 | -101 | -108 | -108 | -41 | -74 | -42 | -37 | -72 |
| 2011 | -93 | -68 | -149 | -164 | -159 | -125 | -134 | -104 | -112 | -105 | -122 | -156 |
| 2012 | -142 | -185 | -130 | -208 | -171 | -139 | -172 | -124 | -133 | -76 | -134 | -141 |
| 2013 | -119 | -121 | -135 | -142 | -195 | -190 | -154 | -169 | -43 | -121 | -154 | -137 |
| 2014 | -186 | -146 | -144 | -189 | -143 | -138 | -154 | -146 | -112 | -84 | -128 | -162 |
| 2015 | -218 | -185 | -121 | -171 | -177 | -119 | -127 | -84 | -110 | -158 | -162 | -137 |
| 2016 | -156 | -128 | -133 | -168 | -147 | -215 | -168 | -141 | -138 | -138 | -148 | -152 |
| 2017 | -126 | -130 | -91 | -170 | -181 | -170 | -158 | -167 | -162 | -134 | -245 | -117 |
| 2018 | -142 | -175 | -140 | -155 | -269 | -155 | -161 | -173 | -151 | -202 | -217 | -156 |
| 2019 | -116 | -177 | -86 | -145 | -176 | -169 | -158 | -130 | -160 | -134 | -165 | -127 |
| 2020 | -142 | -183 | -233 | -88 | -136 | -123 | -226 | -154 | -143 | -140 | -143 | -172 |
| 2021 | -133 | -129 | -137 | -262 | -110 | -172 | -219 | -238 | -173 | -177 | -230 | -179 |
| 2022 | -249 | -160 | -244 | -223 | -269 | -320 | -300 | -220 | -226 | -259 | -193 | -161 |
| 2023 | -125 | -157 | -269 | -197 | -277 | -176 | -133 | -127 | -137 | -55 | -141 | -182 |
| 2024 | -134 | |||||||||||
| - = No Data Reported; -- = Not Applicable; NA = Not Available; W = Withheld to avoid disclosure of individual company data. |
| Release Date: 3/29/2024 |
| Next Release Date: 4/30/2024 |