|
Download Data (XLS File) |
|
||||||||
|
||||||||
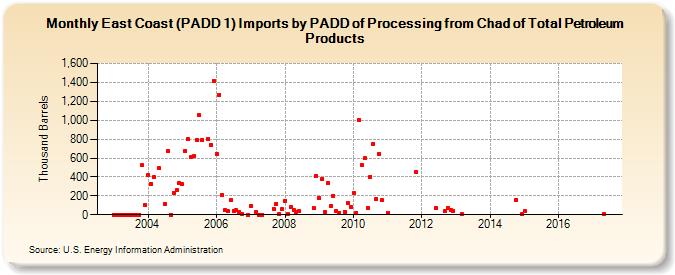
| East Coast (PADD 1) Imports by PADD of Processing from Chad of Total Petroleum Products (Thousand Barrels) | ||||||||
| Year | Jan | Feb | Mar | Apr | May | Jun | Jul | Aug | Sep | Oct | Nov | Dec |
|---|---|---|---|---|---|---|---|---|---|---|---|---|
| 2003 | 0 | 0 | 0 | 0 | 0 | 0 | 0 | 0 | 0 | 0 | 523 | 100 |
| 2004 | 419 | 328 | 395 | 490 | 117 | 670 | 1 | 234 | 261 | 335 | ||
| 2005 | 323 | 679 | 797 | 614 | 618 | 793 | 1,050 | 792 | 801 | 741 | 1,418 | |
| 2006 | 647 | 1,267 | 211 | 46 | 35 | 154 | 42 | 45 | 25 | 8 | 2 | |
| 2007 | 93 | 30 | 2 | 2 | 64 | 116 | 10 | 57 | ||||
| 2008 | 149 | 10 | 79 | 46 | 34 | 38 | 74 | 410 | ||||
| 2009 | 178 | 381 | 33 | 333 | 90 | 203 | 36 | 23 | 34 | 125 | 86 | |
| 2010 | 232 | 17 | 1,007 | 525 | 595 | 74 | 403 | 753 | 167 | 646 | 151 | |
| 2011 | 21 | 454 | ||||||||||
| 2012 | 72 | 39 | 70 | 48 | 40 | |||||||
| 2013 | 4 | |||||||||||
| 2014 | 159 | 7 | ||||||||||
| 2015 | 37 | |||||||||||
| 2017 | 6 | |||||||||||
| - = No Data Reported; -- = Not Applicable; NA = Not Available; W = Withheld to avoid disclosure of individual company data. |
| Release Date: 3/29/2024 |
| Next Release Date: 4/30/2024 |