|
Download Data (XLS File) |
|
||||||||
|
||||||||
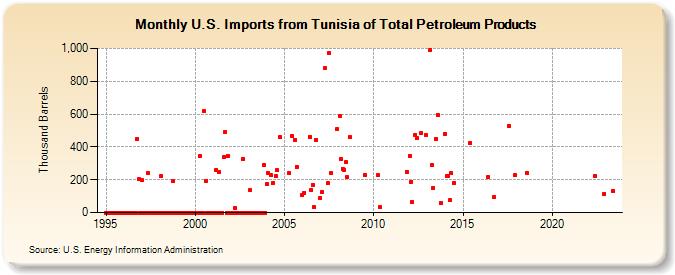
| U.S. Imports from Tunisia of Total Petroleum Products (Thousand Barrels) | ||||||||
| Year | Jan | Feb | Mar | Apr | May | Jun | Jul | Aug | Sep | Oct | Nov | Dec |
|---|---|---|---|---|---|---|---|---|---|---|---|---|
| 1995 | 0 | 0 | 0 | 0 | 0 | 0 | 0 | 0 | 0 | 0 | 0 | 0 |
| 1996 | 0 | 0 | 0 | 0 | 0 | 0 | 0 | 0 | 0 | 451 | 203 | 0 |
| 1997 | 198 | 0 | 0 | 0 | 241 | 0 | 0 | 0 | 0 | 0 | 0 | 0 |
| 1998 | 0 | 222 | 0 | 0 | 0 | 0 | 0 | 0 | 0 | 191 | 0 | 0 |
| 1999 | 0 | 0 | 0 | 0 | 0 | 0 | 0 | 0 | 0 | 0 | 0 | 0 |
| 2000 | 0 | 0 | 0 | 344 | 0 | 0 | 616 | 194 | 0 | 0 | 0 | 0 |
| 2001 | 0 | 0 | 260 | 0 | 249 | 0 | 0 | 336 | 492 | 0 | 343 | 0 |
| 2002 | 0 | 0 | 0 | 27 | 0 | 0 | 0 | 0 | 325 | 0 | 0 | 0 |
| 2003 | 0 | 135 | 0 | 0 | 0 | 0 | 0 | 0 | 0 | 0 | 290 | 0 |
| 2004 | 171 | 241 | 227 | 181 | 224 | 257 | 458 | |||||
| 2005 | 241 | 467 | 445 | 280 | ||||||||
| 2006 | 107 | 122 | 462 | 140 | 170 | 33 | 443 | |||||
| 2007 | 90 | 124 | 878 | 178 | 969 | 238 | 508 | |||||
| 2008 | 591 | 326 | 267 | 261 | 305 | 214 | 459 | |||||
| 2009 | 229 | |||||||||||
| 2010 | 228 | 32 | ||||||||||
| 2011 | 249 | |||||||||||
| 2012 | 345 | 189 | 63 | 471 | 452 | 485 | 472 | |||||
| 2013 | 993 | 291 | 151 | 451 | 595 | 59 | ||||||
| 2014 | 481 | 223 | 220 | 74 | 240 | 182 | ||||||
| 2015 | 424 | |||||||||||
| 2016 | 218 | 94 | ||||||||||
| 2017 | 526 | 226 | ||||||||||
| 2018 | 242 | |||||||||||
| 2022 | 223 | 116 | ||||||||||
| 2023 | 133 | |||||||||||
| - = No Data Reported; -- = Not Applicable; NA = Not Available; W = Withheld to avoid disclosure of individual company data. |
| Release Date: 3/29/2024 |
| Next Release Date: 4/30/2024 |
Referring Pages: