|
Download Data (XLS File) |
|
||||||||
|
||||||||
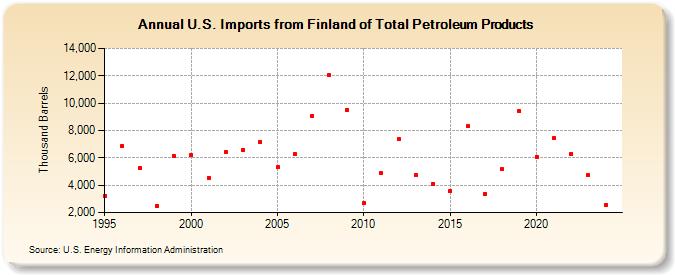
| U.S. Imports from Finland of Total Petroleum Products (Thousand Barrels) | ||||||||
| Decade | Year-0 | Year-1 | Year-2 | Year-3 | Year-4 | Year-5 | Year-6 | Year-7 | Year-8 | Year-9 |
|---|---|---|---|---|---|---|---|---|---|---|
| 1990's | 3,234 | 6,895 | 5,262 | 2,492 | 6,117 | |||||
| 2000's | 6,191 | 4,550 | 6,438 | 6,557 | 7,193 | 5,306 | 6,296 | 9,064 | 12,028 | 9,525 |
| 2010's | 2,665 | 4,872 | 7,348 | 4,734 | 4,112 | 3,591 | 8,299 | 3,376 | 5,181 | 9,413 |
| 2020's | 6,080 | 7,432 | 6,287 | 4,717 |
| - = No Data Reported; -- = Not Applicable; NA = Not Available; W = Withheld to avoid disclosure of individual company data. |
| Release Date: 3/29/2024 |
| Next Release Date: 8/30/2024 |
Referring Pages: