|
Download Data (XLS File) |
|
||||||||
|
||||||||
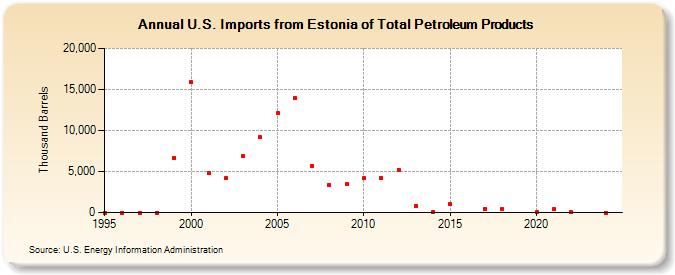
| U.S. Imports from Estonia of Total Petroleum Products (Thousand Barrels) | ||||||||
| Decade | Year-0 | Year-1 | Year-2 | Year-3 | Year-4 | Year-5 | Year-6 | Year-7 | Year-8 | Year-9 |
|---|---|---|---|---|---|---|---|---|---|---|
| 1990's | 0 | 0 | 0 | 0 | 6,657 | |||||
| 2000's | 15,871 | 4,844 | 4,198 | 6,842 | 9,160 | 12,122 | 13,925 | 5,716 | 3,410 | 3,455 |
| 2010's | 4,158 | 4,207 | 5,216 | 773 | 117 | 1,030 | 490 | 448 | ||
| 2020's | 55 | 394 | 49 |
| - = No Data Reported; -- = Not Applicable; NA = Not Available; W = Withheld to avoid disclosure of individual company data. |
| Release Date: 3/29/2024 |
| Next Release Date: 8/30/2024 |
Referring Pages: