|
Download Data (XLS File) |
|
||||||||
|
||||||||
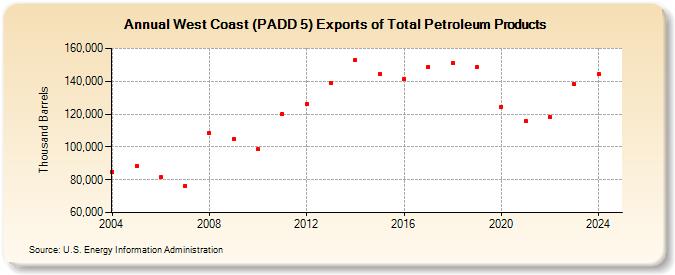
| West Coast (PADD 5) Exports of Total Petroleum Products (Thousand Barrels) | ||||||||
| Decade | Year-0 | Year-1 | Year-2 | Year-3 | Year-4 | Year-5 | Year-6 | Year-7 | Year-8 | Year-9 |
|---|---|---|---|---|---|---|---|---|---|---|
| 2000's | 84,857 | 88,657 | 81,451 | 76,395 | 108,298 | 104,855 | ||||
| 2010's | 98,489 | 120,107 | 126,026 | 139,093 | 153,204 | 144,252 | 141,316 | 148,870 | 151,405 | 148,946 |
| 2020's | 124,550 | 115,636 | 117,995 | 138,246 |
| - = No Data Reported; -- = Not Applicable; NA = Not Available; W = Withheld to avoid disclosure of individual company data. |
| Release Date: 8/30/2024 |
| Next Release Date: 8/29/2025 |