|
Download Data (XLS File) |
|
||||||||
|
||||||||
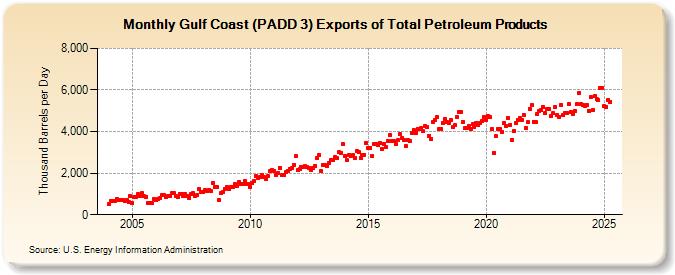
| Gulf Coast (PADD 3) Exports of Total Petroleum Products (Thousand Barrels per Day) | ||||||||
| Year | Jan | Feb | Mar | Apr | May | Jun | Jul | Aug | Sep | Oct | Nov | Dec |
|---|---|---|---|---|---|---|---|---|---|---|---|---|
| 2004 | 502 | 681 | 659 | 665 | 756 | 698 | 720 | 710 | 654 | 692 | 622 | 883 |
| 2005 | 558 | 838 | 868 | 979 | 890 | 1,031 | 885 | 866 | 556 | 545 | 541 | 756 |
| 2006 | 697 | 774 | 811 | 939 | 947 | 835 | 877 | 878 | 1,024 | 1,048 | 924 | 835 |
| 2007 | 1,013 | 978 | 897 | 983 | 924 | 807 | 992 | 1,024 | 893 | 936 | 1,227 | 1,108 |
| 2008 | 1,108 | 1,165 | 1,163 | 1,202 | 1,140 | 1,518 | 1,323 | 1,341 | 712 | 1,031 | 1,103 | 1,256 |
| 2009 | 1,343 | 1,223 | 1,324 | 1,330 | 1,481 | 1,371 | 1,567 | 1,471 | 1,462 | 1,628 | 1,461 | 1,471 |
| 2010 | 1,357 | 1,521 | 1,618 | 1,846 | 1,765 | 1,802 | 1,910 | 1,806 | 1,737 | 1,859 | 2,100 | 2,134 |
| 2011 | 2,114 | 1,903 | 2,009 | 2,265 | 1,897 | 1,902 | 2,041 | 2,121 | 2,216 | 2,234 | 2,406 | 2,802 |
| 2012 | 2,142 | 2,187 | 2,302 | 2,313 | 2,329 | 2,292 | 2,259 | 2,166 | 2,268 | 2,367 | 2,711 | 2,864 |
| 2013 | 2,089 | 2,404 | 2,380 | 2,366 | 2,477 | 2,620 | 2,645 | 2,770 | 2,725 | 3,001 | 2,989 | 3,387 |
| 2014 | 2,827 | 2,623 | 2,851 | 2,808 | 2,871 | 2,732 | 3,041 | 3,026 | 2,750 | 2,852 | 2,892 | 3,447 |
| 2015 | 3,211 | 3,228 | 2,847 | 3,423 | 3,404 | 3,330 | 3,466 | 3,179 | 3,422 | 3,236 | 3,552 | 3,852 |
| 2016 | 3,541 | 3,525 | 3,401 | 3,570 | 3,873 | 3,686 | 3,608 | 3,282 | 3,603 | 3,545 | 3,928 | 4,071 |
| 2017 | 3,936 | 4,143 | 4,128 | 4,150 | 4,010 | 4,251 | 4,218 | 3,786 | 3,646 | 4,469 | 4,556 | 4,677 |
| 2018 | 4,122 | 4,128 | 4,402 | 4,610 | 4,451 | 4,410 | 4,568 | 4,237 | 4,309 | 4,707 | 4,940 | 4,932 |
| 2019 | 4,452 | 4,163 | 4,169 | 4,256 | 4,128 | 4,344 | 4,222 | 4,428 | 4,293 | 4,421 | 4,518 | 4,703 |
| 2020 | 4,568 | 4,743 | 4,692 | 4,106 | 2,983 | 3,773 | 4,113 | 4,120 | 3,990 | 4,421 | 4,264 | 4,663 |
| 2021 | 4,331 | 3,609 | 4,033 | 4,423 | 4,578 | 4,635 | 4,579 | 4,801 | 4,184 | 4,442 | 5,089 | 5,266 |
| 2022 | 4,474 | 4,481 | 4,853 | 4,990 | 5,017 | 5,179 | 4,876 | 5,073 | 5,074 | 4,734 | 4,886 | 5,181 |
| 2023 | 4,804 | 4,793 | 5,333 | 4,674 | 4,836 | 5,042 | 5,170 | 4,797 | 4,865 | 4,950 | 5,263 | 5,937 |
| 2024 | 5,344 | |||||||||||
| - = No Data Reported; -- = Not Applicable; NA = Not Available; W = Withheld to avoid disclosure of individual company data. |
| Release Date: 3/29/2024 |
| Next Release Date: 4/30/2024 |