|
Download Data (XLS File) |
|
||||||||
|
||||||||
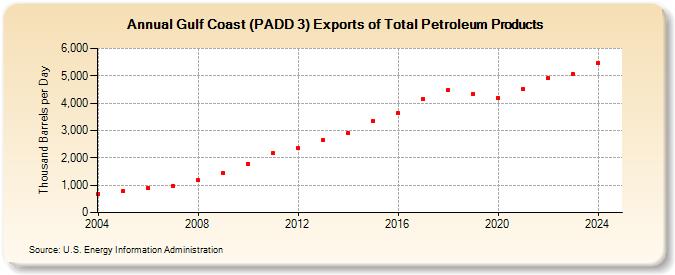
| Gulf Coast (PADD 3) Exports of Total Petroleum Products (Thousand Barrels per Day) | ||||||||
| Decade | Year-0 | Year-1 | Year-2 | Year-3 | Year-4 | Year-5 | Year-6 | Year-7 | Year-8 | Year-9 |
|---|---|---|---|---|---|---|---|---|---|---|
| 2000's | 687 | 776 | 883 | 982 | 1,172 | 1,430 | ||||
| 2010's | 1,789 | 2,161 | 2,351 | 2,656 | 2,897 | 3,346 | 3,636 | 4,164 | 4,487 | 4,343 |
| 2020's | 4,202 | 4,504 | 4,903 | 5,042 |
| - = No Data Reported; -- = Not Applicable; NA = Not Available; W = Withheld to avoid disclosure of individual company data. |
| Release Date: 3/29/2024 |
| Next Release Date: 8/30/2024 |