|
Download Data (XLS File) |
|
||||||||
|
||||||||
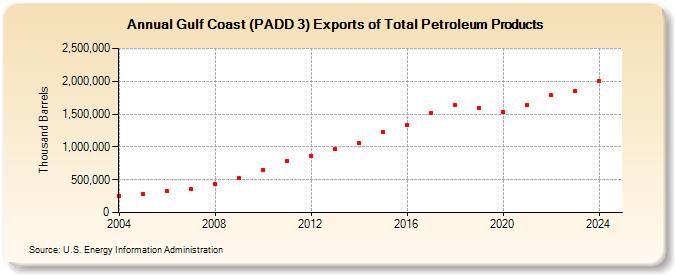
| Gulf Coast (PADD 3) Exports of Total Petroleum Products (Thousand Barrels) | ||||||||
| Decade | Year-0 | Year-1 | Year-2 | Year-3 | Year-4 | Year-5 | Year-6 | Year-7 | Year-8 | Year-9 |
|---|---|---|---|---|---|---|---|---|---|---|
| 2000's | 251,491 | 283,121 | 322,220 | 358,351 | 429,056 | 521,802 | ||||
| 2010's | 652,998 | 788,686 | 860,291 | 969,539 | 1,057,262 | 1,221,258 | 1,330,807 | 1,520,035 | 1,637,681 | 1,585,135 |
| 2020's | 1,537,959 | 1,643,940 | 1,789,737 | 1,840,155 |
| - = No Data Reported; -- = Not Applicable; NA = Not Available; W = Withheld to avoid disclosure of individual company data. |
| Release Date: 3/29/2024 |
| Next Release Date: 8/30/2024 |