|
Download Data (XLS File) |
|
||||||||
|
||||||||
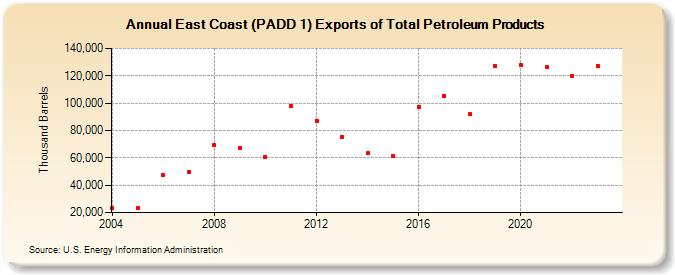
| East Coast (PADD 1) Exports of Total Petroleum Products (Thousand Barrels) | ||||||||
| Decade | Year-0 | Year-1 | Year-2 | Year-3 | Year-4 | Year-5 | Year-6 | Year-7 | Year-8 | Year-9 |
|---|---|---|---|---|---|---|---|---|---|---|
| 2000's | 23,496 | 23,523 | 47,731 | 49,854 | 69,191 | 67,538 | ||||
| 2010's | 60,908 | 97,990 | 87,287 | 75,299 | 63,486 | 61,124 | 97,356 | 104,947 | 91,804 | 127,076 |
| 2020's | 128,071 | 126,436 | 119,755 | 126,612 | 150,681 |
| - = No Data Reported; -- = Not Applicable; NA = Not Available; W = Withheld to avoid disclosure of individual company data. |
| Release Date: 6/30/2025 |
| Next Release Date: 8/29/2025 |