|
Download Data (XLS File) |
|
||||||||
|
||||||||
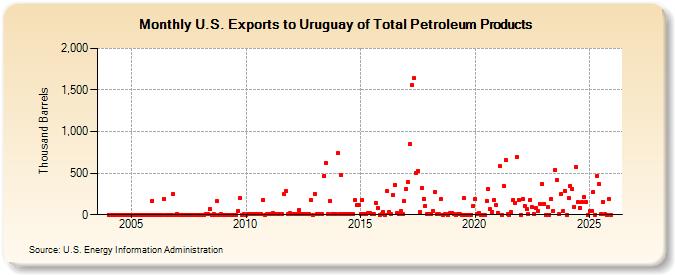
| U.S. Exports to Uruguay of Total Petroleum Products (Thousand Barrels) | ||||||||
| Year | Jan | Feb | Mar | Apr | May | Jun | Jul | Aug | Sep | Oct | Nov | Dec |
|---|---|---|---|---|---|---|---|---|---|---|---|---|
| 2004 | 0 | 1 | 2 | 1 | 1 | 1 | 0 | 1 | 1 | 1 | 1 | 1 |
| 2005 | 1 | 0 | 0 | 0 | 1 | 0 | 0 | 1 | 0 | 0 | 0 | 169 |
| 2006 | 1 | 0 | 0 | 0 | 1 | 194 | 0 | 1 | 1 | 0 | 251 | 1 |
| 2007 | 7 | 0 | 0 | 1 | 1 | 1 | 0 | 1 | 0 | 1 | 1 | 1 |
| 2008 | 2 | 1 | 1 | 3 | 3 | 66 | 1 | 4 | 1 | 160 | 2 | 3 |
| 2009 | 2 | 1 | 1 | 1 | 1 | 2 | 2 | 2 | 47 | 201 | 2 | 4 |
| 2010 | 1 | 3 | 5 | 4 | 4 | 5 | 6 | 8 | 4 | 180 | 2 | 3 |
| 2011 | 3 | 5 | 18 | 4 | 7 | 8 | 3 | 3 | 253 | 285 | 5 | 17 |
| 2012 | 4 | 4 | 8 | 4 | 55 | 5 | 3 | 6 | 4 | 3 | 177 | 2 |
| 2013 | 255 | 3 | 4 | 7 | 7 | 468 | 623 | 5 | 166 | 3 | 8 | 3 |
| 2014 | 738 | 8 | 483 | 7 | 8 | 3 | 4 | 4 | 6 | 174 | 116 | 119 |
| 2015 | 6 | 177 | 3 | 3 | 17 | 16 | 3 | 4 | 142 | 84 | 2 | 3 |
| 2016 | 29 | 2 | 281 | 31 | 3 | 239 | 363 | 18 | 4 | 42 | 10 | 167 |
| 2017 | 308 | 392 | 853 | 1,556 | 1,640 | 506 | 525 | 32 | 327 | 192 | 108 | 3 |
| 2018 | 4 | 5 | 50 | 279 | 4 | 4 | 185 | 2 | 3 | 3 | 1 | 17 |
| 2019 | 20 | 4 | 2 | 3 | 3 | 2 | 195 | 1 | 2 | 2 | 2 | 108 |
| 2020 | 183 | 3 | 20 | 1 | 2 | 1 | 170 | 310 | 63 | 38 | 180 | 116 |
| 2021 | 20 | 582 | 2 | 348 | 660 | 3 | 1 | 29 | 181 | 142 | 696 | 171 |
| 2022 | 2 | 189 | 107 | 66 | 7 | 181 | 93 | 5 | 75 | 44 | 132 | 375 |
| 2023 | 132 | 2 | 93 | 2 | 183 | 40 | 539 | 418 | 4 | 249 | 40 | 289 |
| 2024 | 1 | |||||||||||
| - = No Data Reported; -- = Not Applicable; NA = Not Available; W = Withheld to avoid disclosure of individual company data. |
| Release Date: 3/29/2024 |
| Next Release Date: 4/30/2024 |