|
Download Data (XLS File) |
|
||||||||
|
||||||||
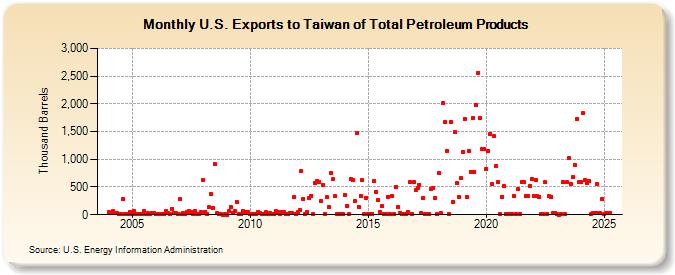
| U.S. Exports to Taiwan of Total Petroleum Products (Thousand Barrels) | ||||||||
| Year | Jan | Feb | Mar | Apr | May | Jun | Jul | Aug | Sep | Oct | Nov | Dec |
|---|---|---|---|---|---|---|---|---|---|---|---|---|
| 2004 | 40 | 24 | 59 | 22 | 34 | 18 | 16 | 282 | 16 | 16 | 8 | 47 |
| 2005 | 8 | 62 | 6 | 7 | 12 | 8 | 64 | 8 | 24 | 9 | 34 | 32 |
| 2006 | 7 | 7 | 5 | 4 | 9 | 61 | 28 | 16 | 110 | 33 | 25 | 16 |
| 2007 | 281 | 5 | 24 | 21 | 48 | 58 | 52 | 11 | 66 | 6 | 9 | 50 |
| 2008 | 623 | 49 | 13 | 132 | 371 | 130 | 907 | 22 | 9 | 4 | 2 | 4 |
| 2009 | 3 | 61 | 146 | 37 | 58 | 234 | 8 | 21 | 69 | 56 | 42 | 42 |
| 2010 | 20 | 10 | 11 | 8 | 50 | 31 | 5 | 12 | 42 | 9 | 32 | 7 |
| 2011 | 5 | 59 | 42 | 15 | 51 | 46 | 6 | 4 | 32 | 30 | 316 | 13 |
| 2012 | 44 | 85 | 791 | 290 | 12 | 41 | 294 | 344 | 6 | 565 | 613 | 586 |
| 2013 | 244 | 544 | 8 | 314 | 131 | 757 | 638 | 331 | 11 | 20 | 5 | 4 |
| 2014 | 355 | 166 | 7 | 653 | 627 | 242 | 1,474 | 147 | 340 | 619 | 7 | 309 |
| 2015 | 4 | 8 | 9 | 604 | 418 | 269 | 57 | 153 | 6 | 6 | 327 | 6 |
| 2016 | 336 | 5 | 500 | 146 | 26 | 7 | 5 | 7 | 52 | 586 | 8 | 583 |
| 2017 | 441 | 485 | 542 | 38 | 304 | 20 | 7 | 6 | 465 | 483 | 302 | 6 |
| 2018 | 753 | 30 | 2,013 | 1,664 | 1,156 | 10 | 1,679 | 236 | 1,490 | 569 | 328 | 661 |
| 2019 | 1,134 | 1,733 | 326 | 1,156 | 773 | 1,747 | 768 | 1,975 | 2,564 | 1,743 | 1,185 | 1,183 |
| 2020 | 830 | 1,148 | 1,460 | 562 | 1,414 | 882 | 590 | 6 | 325 | 518 | 9 | 14 |
| 2021 | 6 | 11 | 340 | 5 | 459 | 8 | 596 | 585 | 333 | 329 | 526 | 651 |
| 2022 | 343 | 630 | 330 | 325 | 12 | 4 | 582 | 21 | 334 | 328 | 26 | 28 |
| 2023 | 6 | 2 | 7 | 588 | 6 | 587 | 1,015 | 560 | 451 | 1,129 | 1,728 | 585 |
| 2024 | 583 | |||||||||||
| - = No Data Reported; -- = Not Applicable; NA = Not Available; W = Withheld to avoid disclosure of individual company data. |
| Release Date: 3/29/2024 |
| Next Release Date: 4/30/2024 |