|
Download Data (XLS File) |
|
||||||||
|
||||||||
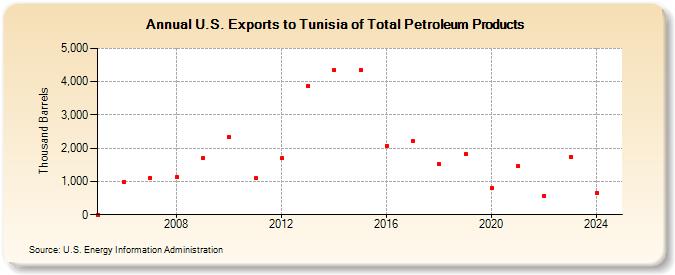
| U.S. Exports to Tunisia of Total Petroleum Products (Thousand Barrels) | ||||||||
| Decade | Year-0 | Year-1 | Year-2 | Year-3 | Year-4 | Year-5 | Year-6 | Year-7 | Year-8 | Year-9 |
|---|---|---|---|---|---|---|---|---|---|---|
| 2000's | 2 | 991 | 1,107 | 1,140 | 1,692 | |||||
| 2010's | 2,322 | 1,103 | 1,692 | 3,883 | 4,357 | 4,356 | 2,072 | 2,202 | 1,511 | 1,820 |
| 2020's | 789 | 1,458 | 571 | 1,743 |
| - = No Data Reported; -- = Not Applicable; NA = Not Available; W = Withheld to avoid disclosure of individual company data. |
| Release Date: 8/30/2024 |
| Next Release Date: 8/29/2025 |