|
Download Data (XLS File) |
|
||||||||
|
||||||||
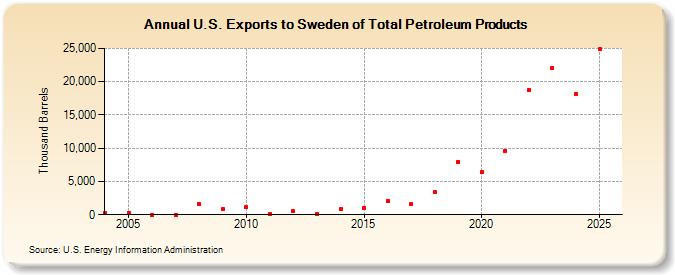
| U.S. Exports to Sweden of Total Petroleum Products (Thousand Barrels) | ||||||||
| Decade | Year-0 | Year-1 | Year-2 | Year-3 | Year-4 | Year-5 | Year-6 | Year-7 | Year-8 | Year-9 |
|---|---|---|---|---|---|---|---|---|---|---|
| 2000's | 227 | 222 | 13 | 23 | 1,540 | 844 | ||||
| 2010's | 1,096 | 49 | 488 | 132 | 860 | 1,077 | 2,097 | 1,544 | 3,425 | 7,963 |
| 2020's | 6,422 | 9,562 | 18,733 | 21,207 |
| - = No Data Reported; -- = Not Applicable; NA = Not Available; W = Withheld to avoid disclosure of individual company data. |
| Release Date: 3/29/2024 |
| Next Release Date: 8/30/2024 |