|
Download Data (XLS File) |
|
||||||||
|
||||||||
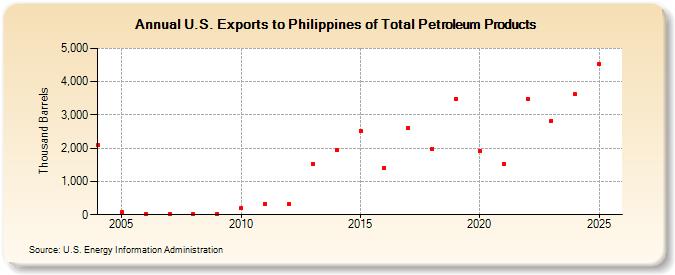
| U.S. Exports to Philippines of Total Petroleum Products (Thousand Barrels) | ||||||||
| Decade | Year-0 | Year-1 | Year-2 | Year-3 | Year-4 | Year-5 | Year-6 | Year-7 | Year-8 | Year-9 |
|---|---|---|---|---|---|---|---|---|---|---|
| 2000's | 2,090 | 73 | 18 | 19 | 18 | 26 | ||||
| 2010's | 200 | 332 | 319 | 1,528 | 1,940 | 2,529 | 1,413 | 2,607 | 1,990 | 3,488 |
| 2020's | 1,921 | 1,532 | 3,485 | 2,829 |
| - = No Data Reported; -- = Not Applicable; NA = Not Available; W = Withheld to avoid disclosure of individual company data. |
| Release Date: 8/30/2024 |
| Next Release Date: 8/29/2025 |