|
Download Data (XLS File) |
|
||||||||
|
||||||||
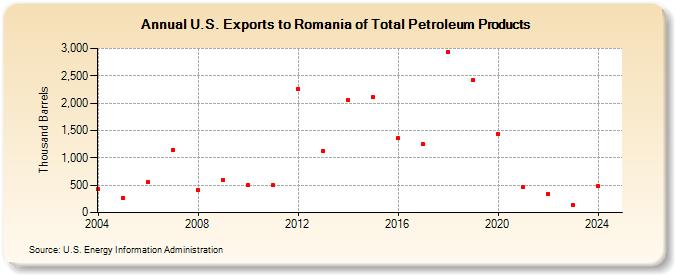
| U.S. Exports to Romania of Total Petroleum Products (Thousand Barrels) | ||||||||
| Decade | Year-0 | Year-1 | Year-2 | Year-3 | Year-4 | Year-5 | Year-6 | Year-7 | Year-8 | Year-9 |
|---|---|---|---|---|---|---|---|---|---|---|
| 2000's | 429 | 265 | 552 | 1,144 | 410 | 596 | ||||
| 2010's | 498 | 499 | 2,262 | 1,126 | 2,049 | 2,105 | 1,355 | 1,248 | 2,940 | 2,419 |
| 2020's | 1,429 | 463 | 346 | 142 |
| - = No Data Reported; -- = Not Applicable; NA = Not Available; W = Withheld to avoid disclosure of individual company data. |
| Release Date: 6/28/2024 |
| Next Release Date: 8/30/2024 |