|
Download Data (XLS File) |
|
||||||||
|
||||||||
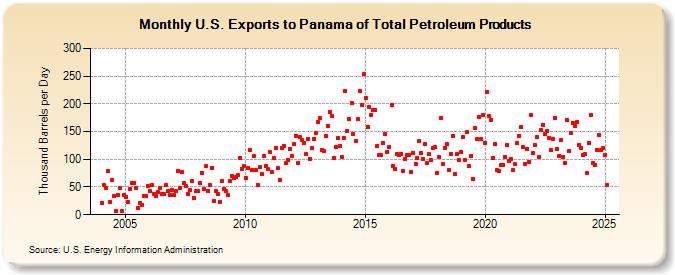
| U.S. Exports to Panama of Total Petroleum Products (Thousand Barrels per Day) | ||||||||
| Year | Jan | Feb | Mar | Apr | May | Jun | Jul | Aug | Sep | Oct | Nov | Dec |
|---|---|---|---|---|---|---|---|---|---|---|---|---|
| 2004 | 22 | 54 | 49 | 78 | 23 | 63 | 34 | 6 | 36 | 48 | 7 | 36 |
| 2005 | 32 | 23 | 46 | 58 | 58 | 49 | 13 | 22 | 18 | 34 | 34 | 52 |
| 2006 | 42 | 54 | 38 | 34 | 41 | 49 | 38 | 38 | 53 | 42 | 35 | 45 |
| 2007 | 36 | 42 | 79 | 49 | 77 | 57 | 52 | 38 | 44 | 61 | 30 | 42 |
| 2008 | 42 | 58 | 76 | 46 | 87 | 43 | 53 | 85 | 25 | 42 | 37 | 23 |
| 2009 | 60 | 47 | 43 | 35 | 60 | 70 | 66 | 68 | 71 | 102 | 83 | 88 |
| 2010 | 67 | 84 | 117 | 81 | 106 | 81 | 54 | 86 | 73 | 106 | 87 | 83 |
| 2011 | 113 | 77 | 103 | 120 | 84 | 63 | 121 | 124 | 93 | 99 | 119 | 106 |
| 2012 | 127 | 142 | 93 | 141 | 135 | 130 | 109 | 137 | 101 | 120 | 137 | 147 |
| 2013 | 168 | 174 | 117 | 115 | 142 | 160 | 186 | 178 | 102 | 122 | 138 | 124 |
| 2014 | 105 | 139 | 223 | 151 | 172 | 202 | 145 | 133 | 172 | 223 | 198 | 253 |
| 2015 | 211 | 159 | 194 | 180 | 188 | 189 | 124 | 108 | 107 | 129 | 145 | 114 |
| 2016 | 123 | 197 | 87 | 82 | 109 | 108 | 110 | 79 | 101 | 107 | 107 | 77 |
| 2017 | 112 | 92 | 103 | 133 | 111 | 101 | 128 | 94 | 109 | 99 | 120 | 122 |
| 2018 | 76 | 104 | 174 | 91 | 121 | 127 | 80 | 110 | 142 | 73 | 109 | 99 |
| 2019 | 114 | 140 | 98 | 149 | 87 | 106 | 65 | 156 | 137 | 177 | 136 | 180 |
| 2020 | 130 | 221 | 178 | 171 | 103 | 127 | 80 | 79 | 89 | 89 | 104 | 125 |
| 2021 | 97 | 100 | 81 | 91 | 129 | 142 | 159 | 122 | 92 | 119 | 95 | 180 |
| 2022 | 111 | 125 | 140 | 105 | 153 | 162 | 146 | 151 | 139 | 117 | 136 | 174 |
| 2023 | 120 | 131 | 145 | 105 | 90 | 187 | 112 | 148 | 182 | 148 | 167 | 126 |
| 2024 | 121 | |||||||||||
| - = No Data Reported; -- = Not Applicable; NA = Not Available; W = Withheld to avoid disclosure of individual company data. |
| Release Date: 3/29/2024 |
| Next Release Date: 4/30/2024 |