|
Download Data (XLS File) |
|
||||||||
|
||||||||
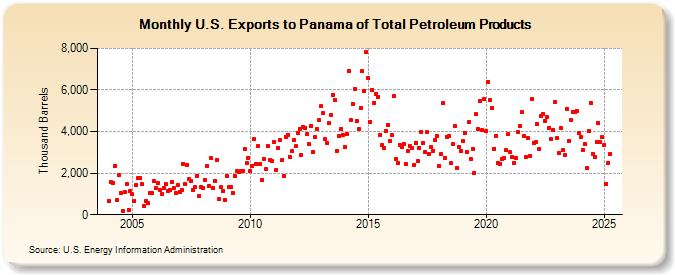
| U.S. Exports to Panama of Total Petroleum Products (Thousand Barrels) | ||||||||
| Year | Jan | Feb | Mar | Apr | May | Jun | Jul | Aug | Sep | Oct | Nov | Dec |
|---|---|---|---|---|---|---|---|---|---|---|---|---|
| 2004 | 668 | 1,573 | 1,522 | 2,355 | 703 | 1,892 | 1,053 | 183 | 1,069 | 1,476 | 221 | 1,117 |
| 2005 | 978 | 651 | 1,420 | 1,744 | 1,785 | 1,462 | 407 | 669 | 544 | 1,066 | 1,021 | 1,623 |
| 2006 | 1,294 | 1,525 | 1,184 | 1,007 | 1,280 | 1,485 | 1,164 | 1,171 | 1,591 | 1,306 | 1,061 | 1,406 |
| 2007 | 1,109 | 1,174 | 2,456 | 1,477 | 2,384 | 1,699 | 1,603 | 1,185 | 1,314 | 1,882 | 891 | 1,309 |
| 2008 | 1,302 | 1,675 | 2,346 | 1,381 | 2,707 | 1,293 | 1,637 | 2,639 | 741 | 1,310 | 1,119 | 728 |
| 2009 | 1,852 | 1,315 | 1,344 | 1,058 | 1,866 | 2,111 | 2,034 | 2,109 | 2,115 | 3,158 | 2,478 | 2,716 |
| 2010 | 2,090 | 2,357 | 3,638 | 2,434 | 3,286 | 2,417 | 1,664 | 2,665 | 2,177 | 3,299 | 2,611 | 2,581 |
| 2011 | 3,517 | 2,150 | 3,186 | 3,591 | 2,614 | 1,884 | 3,759 | 3,857 | 2,789 | 3,055 | 3,570 | 3,284 |
| 2012 | 3,932 | 4,132 | 2,883 | 4,220 | 4,172 | 3,891 | 3,380 | 4,261 | 3,024 | 3,716 | 4,113 | 4,542 |
| 2013 | 5,215 | 4,879 | 3,628 | 3,461 | 4,408 | 4,813 | 5,779 | 5,503 | 3,066 | 3,790 | 4,135 | 3,852 |
| 2014 | 3,253 | 3,899 | 6,905 | 4,534 | 5,341 | 6,046 | 4,501 | 4,118 | 5,148 | 6,903 | 5,944 | 7,836 |
| 2015 | 6,554 | 4,464 | 6,016 | 5,394 | 5,815 | 5,681 | 3,851 | 3,336 | 3,212 | 4,007 | 4,336 | 3,535 |
| 2016 | 3,828 | 5,703 | 2,701 | 2,470 | 3,368 | 3,239 | 3,414 | 2,434 | 3,045 | 3,325 | 3,208 | 2,387 |
| 2017 | 3,460 | 2,569 | 3,200 | 3,980 | 3,455 | 3,025 | 3,958 | 2,915 | 3,264 | 3,079 | 3,609 | 3,786 |
| 2018 | 2,347 | 2,921 | 5,394 | 2,730 | 3,762 | 3,809 | 2,469 | 3,402 | 4,258 | 2,268 | 3,266 | 3,055 |
| 2019 | 3,541 | 3,920 | 3,037 | 4,455 | 2,689 | 3,178 | 2,023 | 4,829 | 4,107 | 5,483 | 4,085 | 5,568 |
| 2020 | 4,018 | 6,403 | 5,507 | 5,131 | 3,183 | 3,801 | 2,468 | 2,463 | 2,683 | 2,744 | 3,109 | 3,866 |
| 2021 | 2,998 | 2,800 | 2,510 | 2,743 | 3,984 | 4,266 | 4,938 | 3,776 | 2,765 | 3,687 | 2,845 | 5,567 |
| 2022 | 3,445 | 3,490 | 4,351 | 3,155 | 4,744 | 4,850 | 4,520 | 4,688 | 4,165 | 3,627 | 4,072 | 5,406 |
| 2023 | 3,733 | 3,665 | 4,486 | 3,137 | 2,794 | 5,622 | 3,472 | 4,595 | 5,463 | 4,598 | 5,005 | 3,907 |
| 2024 | 3,748 | |||||||||||
| - = No Data Reported; -- = Not Applicable; NA = Not Available; W = Withheld to avoid disclosure of individual company data. |
| Release Date: 3/29/2024 |
| Next Release Date: 4/30/2024 |