|
Download Data (XLS File) |
|
||||||||
|
||||||||
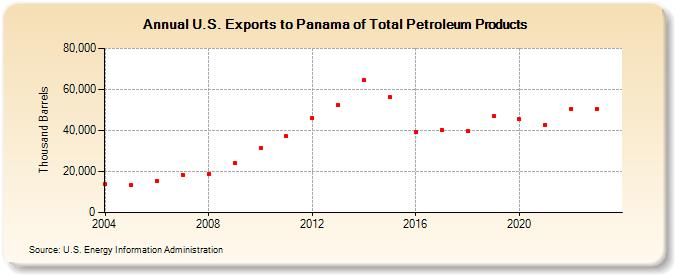
| U.S. Exports to Panama of Total Petroleum Products (Thousand Barrels) | ||||||||
| Decade | Year-0 | Year-1 | Year-2 | Year-3 | Year-4 | Year-5 | Year-6 | Year-7 | Year-8 | Year-9 |
|---|---|---|---|---|---|---|---|---|---|---|
| 2000's | 13,832 | 13,370 | 15,475 | 18,483 | 18,878 | 24,156 | ||||
| 2010's | 31,217 | 37,255 | 46,267 | 52,530 | 64,429 | 56,201 | 39,124 | 40,300 | 39,681 | 46,915 |
| 2020's | 45,374 | 42,879 | 50,513 | 48,874 |
| - = No Data Reported; -- = Not Applicable; NA = Not Available; W = Withheld to avoid disclosure of individual company data. |
| Release Date: 8/30/2024 |
| Next Release Date: 8/29/2025 |