|
Download Data (XLS File) |
|
||||||||
|
||||||||
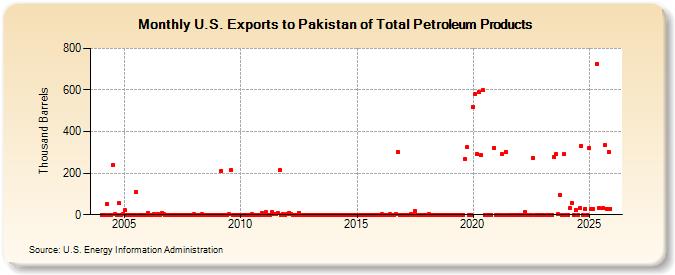
| U.S. Exports to Pakistan of Total Petroleum Products (Thousand Barrels) | ||||||||
| Year | Jan | Feb | Mar | Apr | May | Jun | Jul | Aug | Sep | Oct | Nov | Dec |
|---|---|---|---|---|---|---|---|---|---|---|---|---|
| 2004 | 0 | 0 | 1 | 51 | 0 | 0 | 238 | 2 | 0 | 54 | 0 | 2 |
| 2005 | 21 | 0 | 1 | 1 | 1 | 1 | 109 | 0 | 0 | 0 | 0 | 0 |
| 2006 | 9 | 0 | 0 | 2 | 0 | 2 | 1 | 8 | 2 | 0 | 0 | 1 |
| 2007 | 0 | 0 | 0 | 0 | 0 | 1 | 0 | 0 | 0 | 0 | 0 | 0 |
| 2008 | 2 | 1 | 0 | 0 | 2 | 1 | 1 | 0 | 0 | 1 | 0 | 0 |
| 2009 | 0 | 0 | 212 | 1 | 1 | 1 | 2 | 214 | 1 | 1 | 0 | 0 |
| 2010 | 1 | 1 | 1 | 1 | 0 | 0 | 2 | 1 | 1 | 1 | 0 | 6 |
| 2011 | 1 | 11 | 1 | 1 | 11 | 2 | 2 | 10 | 213 | 1 | 2 | 1 |
| 2012 | 2 | 10 | 2 | 0 | 0 | 0 | 9 | 0 | 1 | 1 | 0 | 1 |
| 2013 | 0 | 1 | 0 | 0 | 0 | 1 | 0 | 0 | 0 | 0 | 0 | 0 |
| 2014 | 0 | 0 | 0 | 1 | 1 | 0 | 0 | 0 | 1 | 0 | 0 | 0 |
| 2015 | 0 | 0 | 1 | 1 | 1 | 0 | 0 | 0 | 1 | 0 | 0 | 0 |
| 2016 | 0 | 2 | 1 | 1 | 1 | 2 | 1 | 1 | 3 | 303 | 1 | 0 |
| 2017 | 1 | 1 | 0 | 1 | 2 | 1 | 16 | 0 | 0 | 1 | 0 | 0 |
| 2018 | 0 | 2 | 1 | 1 | 1 | 1 | 0 | 0 | 0 | 0 | 0 | 0 |
| 2019 | 0 | 0 | 0 | 0 | 0 | 0 | 0 | 1 | 269 | 324 | 0 | 1 |
| 2020 | 520 | 579 | 292 | 589 | 286 | 598 | 0 | 0 | 0 | 1 | 323 | |
| 2021 | 0 | 0 | 0 | 290 | 0 | 303 | 0 | 0 | 0 | 1 | 0 | 0 |
| 2022 | 0 | 0 | 14 | 0 | 1 | 275 | 0 | 0 | 0 | 0 | ||
| 2023 | 0 | 0 | 1 | 0 | 0 | 277 | 292 | 2 | 94 | 0 | 290 | |
| 2024 | 0 | |||||||||||
| - = No Data Reported; -- = Not Applicable; NA = Not Available; W = Withheld to avoid disclosure of individual company data. |
| Release Date: 3/29/2024 |
| Next Release Date: 4/30/2024 |