|
Download Data (XLS File) |
|
||||||||
|
||||||||
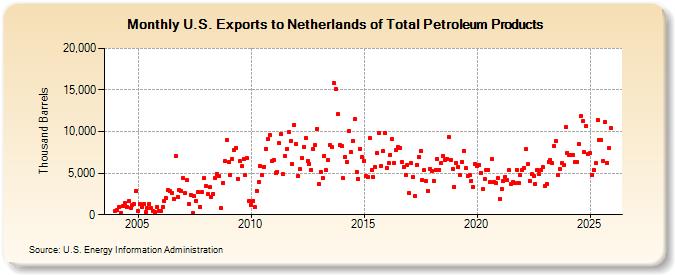
| U.S. Exports to Netherlands of Total Petroleum Products (Thousand Barrels) | ||||||||
| Year | Jan | Feb | Mar | Apr | May | Jun | Jul | Aug | Sep | Oct | Nov | Dec |
|---|---|---|---|---|---|---|---|---|---|---|---|---|
| 2004 | 499 | 541 | 924 | 181 | 988 | 1,437 | 943 | 1,611 | 814 | 1,198 | 1,303 | 2,868 |
| 2005 | 421 | 1,346 | 869 | 1,265 | 313 | 779 | 1,293 | 780 | 405 | 298 | 880 | 489 |
| 2006 | 398 | 924 | 1,599 | 2,029 | 2,935 | 2,817 | 2,657 | 1,933 | 7,048 | 2,182 | 2,989 | 2,859 |
| 2007 | 4,408 | 2,559 | 4,157 | 1,243 | 2,344 | 174 | 2,222 | 1,621 | 2,707 | 979 | 2,717 | 4,364 |
| 2008 | 3,429 | 2,436 | 3,300 | 2,166 | 2,530 | 4,422 | 4,897 | 4,604 | 768 | 3,840 | 6,405 | 9,039 |
| 2009 | 6,287 | 4,824 | 6,742 | 7,840 | 8,060 | 4,341 | 6,417 | 5,811 | 6,724 | 4,726 | 6,777 | 1,708 |
| 2010 | 1,215 | 1,696 | 889 | 2,910 | 3,944 | 5,854 | 4,759 | 5,743 | 7,948 | 9,148 | 9,556 | 6,469 |
| 2011 | 6,581 | 5,045 | 5,192 | 8,599 | 9,682 | 4,888 | 7,048 | 7,948 | 9,943 | 8,863 | 6,127 | 10,779 |
| 2012 | 8,449 | 4,665 | 5,437 | 6,821 | 8,183 | 9,244 | 6,500 | 6,119 | 5,378 | 7,866 | 8,325 | 10,352 |
| 2013 | 3,655 | 5,177 | 4,432 | 7,117 | 5,336 | 6,543 | 8,331 | 8,093 | 15,815 | 15,127 | 12,058 | 8,329 |
| 2014 | 8,208 | 4,372 | 6,924 | 6,337 | 10,063 | 7,504 | 8,880 | 11,454 | 5,150 | 4,298 | 7,958 | 6,968 |
| 2015 | 6,436 | 4,662 | 4,485 | 9,167 | 5,388 | 4,524 | 5,716 | 7,407 | 9,843 | 5,810 | 7,634 | 9,839 |
| 2016 | 5,659 | 6,171 | 7,212 | 9,054 | 6,277 | 7,727 | 8,117 | 8,041 | 6,346 | 5,694 | 4,835 | 5,960 |
| 2017 | 2,585 | 6,192 | 4,505 | 2,223 | 6,011 | 6,993 | 7,654 | 4,135 | 5,346 | 4,052 | 2,899 | 5,519 |
| 2018 | 5,223 | 4,070 | 5,378 | 6,700 | 5,411 | 6,230 | 7,102 | 6,575 | 6,746 | 9,367 | 6,634 | 5,517 |
| 2019 | 3,364 | 6,241 | 5,782 | 4,717 | 6,386 | 7,670 | 5,630 | 4,683 | 4,730 | 4,106 | 3,309 | 6,109 |
| 2020 | 5,906 | 6,031 | 5,063 | 3,034 | 4,310 | 5,383 | 5,429 | 3,933 | 6,712 | 3,938 | 3,801 | 4,370 |
| 2021 | 1,935 | 3,127 | 4,100 | 4,581 | 4,132 | 5,360 | 3,716 | 3,927 | 3,806 | 5,381 | 3,818 | 4,751 |
| 2022 | 5,322 | 5,640 | 7,849 | 6,057 | 4,108 | 4,847 | 4,706 | 3,705 | 5,421 | 4,838 | 5,378 | 5,679 |
| 2023 | 3,764 | 3,441 | 7,036 | 7,842 | 5,676 | 8,444 | 8,477 | 4,412 | 5,732 | 6,137 | 5,957 | 10,502 |
| 2024 | 8,119 | |||||||||||
| - = No Data Reported; -- = Not Applicable; NA = Not Available; W = Withheld to avoid disclosure of individual company data. |
| Release Date: 3/29/2024 |
| Next Release Date: 4/30/2024 |