|
Download Data (XLS File) |
|
||||||||
|
||||||||
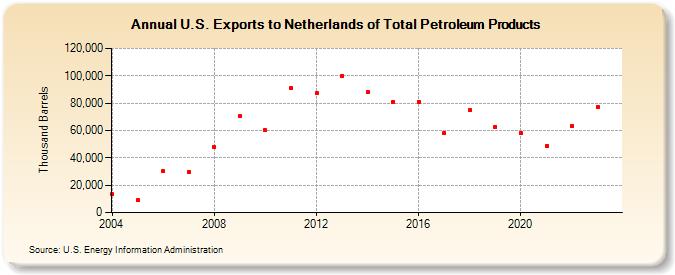
| U.S. Exports to Netherlands of Total Petroleum Products (Thousand Barrels) | ||||||||
| Decade | Year-0 | Year-1 | Year-2 | Year-3 | Year-4 | Year-5 | Year-6 | Year-7 | Year-8 | Year-9 |
|---|---|---|---|---|---|---|---|---|---|---|
| 2000's | 13,306 | 9,139 | 30,370 | 29,497 | 47,836 | 70,256 | ||||
| 2010's | 60,131 | 90,695 | 87,339 | 100,013 | 88,118 | 80,910 | 81,090 | 58,113 | 74,952 | 62,727 |
| 2020's | 57,911 | 48,635 | 63,549 | 76,352 |
| - = No Data Reported; -- = Not Applicable; NA = Not Available; W = Withheld to avoid disclosure of individual company data. |
| Release Date: 8/30/2024 |
| Next Release Date: 8/29/2025 |