|
Download Data (XLS File) |
|
||||||||
|
||||||||
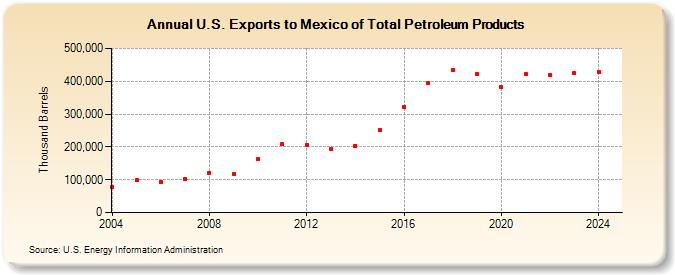
| U.S. Exports to Mexico of Total Petroleum Products (Thousand Barrels) | ||||||||
| Decade | Year-0 | Year-1 | Year-2 | Year-3 | Year-4 | Year-5 | Year-6 | Year-7 | Year-8 | Year-9 |
|---|---|---|---|---|---|---|---|---|---|---|
| 2000's | 76,413 | 97,868 | 92,990 | 101,743 | 121,835 | 117,454 | ||||
| 2010's | 163,439 | 207,870 | 206,757 | 194,025 | 203,855 | 251,843 | 321,925 | 394,402 | 434,910 | 422,565 |
| 2020's | 381,328 | 421,812 | 420,318 | 425,308 |
| - = No Data Reported; -- = Not Applicable; NA = Not Available; W = Withheld to avoid disclosure of individual company data. |
| Release Date: 3/29/2024 |
| Next Release Date: 8/30/2024 |