|
Download Data (XLS File) |
|
||||||||
|
||||||||
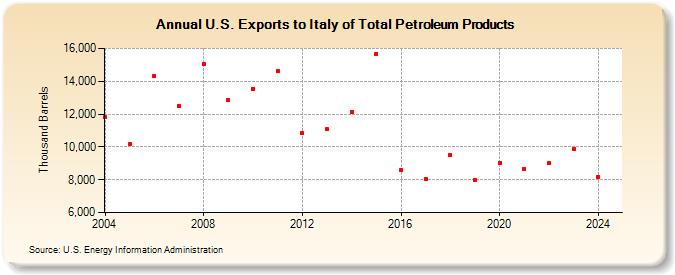
| U.S. Exports to Italy of Total Petroleum Products (Thousand Barrels) | ||||||||
| Decade | Year-0 | Year-1 | Year-2 | Year-3 | Year-4 | Year-5 | Year-6 | Year-7 | Year-8 | Year-9 |
|---|---|---|---|---|---|---|---|---|---|---|
| 2000's | 11,803 | 10,182 | 14,342 | 12,513 | 15,051 | 12,863 | ||||
| 2010's | 13,542 | 14,634 | 10,844 | 11,062 | 12,136 | 15,669 | 8,604 | 8,033 | 9,531 | 7,987 |
| 2020's | 9,028 | 8,658 | 9,017 | 9,997 |
| - = No Data Reported; -- = Not Applicable; NA = Not Available; W = Withheld to avoid disclosure of individual company data. |
| Release Date: 4/30/2024 |
| Next Release Date: 8/30/2024 |