|
Download Data (XLS File) |
|
||||||||
|
||||||||
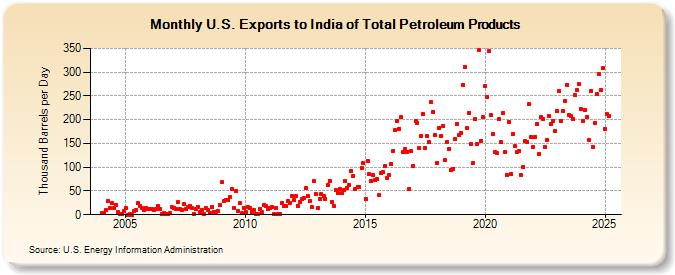
| U.S. Exports to India of Total Petroleum Products (Thousand Barrels per Day) | ||||||||
| Year | Jan | Feb | Mar | Apr | May | Jun | Jul | Aug | Sep | Oct | Nov | Dec |
|---|---|---|---|---|---|---|---|---|---|---|---|---|
| 2004 | 4 | 4 | 9 | 28 | 15 | 24 | 14 | 20 | 5 | 2 | 2 | 7 |
| 2005 | 15 | 0 | 2 | 0 | 7 | 9 | 24 | 19 | 14 | 10 | 15 | 12 |
| 2006 | 11 | 13 | 9 | 11 | 18 | 13 | 1 | 3 | 1 | 1 | 3 | 16 |
| 2007 | 15 | 12 | 26 | 12 | 9 | 23 | 12 | 16 | 18 | 15 | 1 | 12 |
| 2008 | 16 | 5 | 9 | 1 | 14 | 9 | 4 | 17 | 6 | 6 | 8 | 20 |
| 2009 | 68 | 28 | 32 | 30 | 38 | 54 | 15 | 49 | 7 | 24 | 3 | 15 |
| 2010 | 6 | 17 | 15 | 6 | 9 | 1 | 2 | 12 | 5 | 20 | 18 | 12 |
| 2011 | 15 | 16 | 2 | 15 | 1 | 1 | 24 | 18 | 19 | 28 | 25 | 39 |
| 2012 | 30 | 39 | 19 | 27 | 33 | 36 | 56 | 40 | 29 | 16 | 70 | 43 |
| 2013 | 14 | 33 | 43 | 39 | 34 | 62 | 71 | 27 | 19 | 51 | 45 | 55 |
| 2014 | 45 | 52 | 70 | 57 | 62 | 91 | 82 | 55 | 59 | 58 | 98 | 109 |
| 2015 | 34 | 114 | 85 | 70 | 83 | 72 | 75 | 41 | 87 | 89 | 103 | 77 |
| 2016 | 84 | 107 | 135 | 178 | 198 | 181 | 205 | 133 | 138 | 133 | 54 | 134 |
| 2017 | 102 | 197 | 193 | 140 | 166 | 211 | 140 | 165 | 152 | 237 | 217 | 167 |
| 2018 | 109 | 183 | 166 | 187 | 115 | 152 | 139 | 95 | 97 | 159 | 191 | 167 |
| 2019 | 172 | 273 | 311 | 182 | 215 | 148 | 109 | 201 | 148 | 347 | 156 | 206 |
| 2020 | 270 | 248 | 344 | 209 | 169 | 131 | 129 | 201 | 152 | 215 | 132 | 83 |
| 2021 | 196 | 86 | 170 | 144 | 131 | 134 | 84 | 100 | 155 | 154 | 232 | 164 |
| 2022 | 143 | 164 | 191 | 128 | 205 | 201 | 142 | 158 | 208 | 191 | 198 | 176 |
| 2023 | 218 | 261 | 197 | 218 | 240 | 273 | 210 | 208 | 201 | 251 | 262 | 275 |
| 2024 | 223 | 197 | 221 | 205 | 158 | 260 | 143 | 194 | 253 | 296 | 262 | 308 |
| 2025 | 181 | 211 | 207 | 308 | ||||||||
| - = No Data Reported; -- = Not Applicable; NA = Not Available; W = Withheld to avoid disclosure of individual company data. |
| Release Date: 6/30/2025 |
| Next Release Date: 7/31/2025 |