|
Download Data (XLS File) |
|
||||||||
|
||||||||
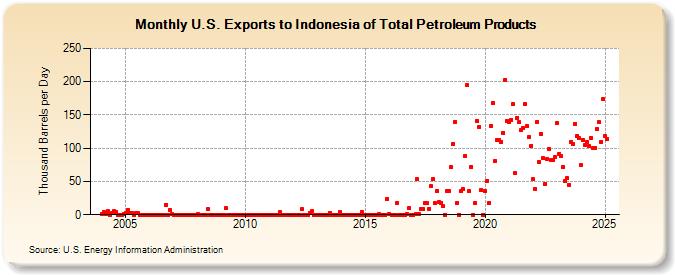
| U.S. Exports to Indonesia of Total Petroleum Products (Thousand Barrels per Day) | ||||||||
| Year | Jan | Feb | Mar | Apr | May | Jun | Jul | Aug | Sep | Oct | Nov | Dec |
|---|---|---|---|---|---|---|---|---|---|---|---|---|
| 2004 | 1 | 4 | 1 | 5 | 0 | 2 | 5 | 4 | 0 | 0 | 0 | 1 |
| 2005 | 2 | 7 | 2 | 3 | 0 | 2 | 2 | 0 | 0 | 0 | 0 | 0 |
| 2006 | 0 | 0 | 0 | 0 | 0 | 0 | 0 | 0 | 15 | 0 | 7 | 1 |
| 2007 | 0 | 0 | 0 | 0 | 0 | 0 | 0 | 0 | 0 | 0 | 0 | 0 |
| 2008 | 1 | 0 | 0 | 0 | 0 | 8 | 0 | 0 | 0 | 0 | 0 | 0 |
| 2009 | 0 | 0 | 10 | 0 | 0 | 0 | 0 | 0 | 0 | 0 | 0 | 0 |
| 2010 | 0 | 0 | 0 | 0 | 0 | 0 | 0 | 0 | 0 | 0 | 0 | 0 |
| 2011 | 0 | 0 | 0 | 0 | 0 | 4 | 0 | 0 | 0 | 0 | 0 | 0 |
| 2012 | 0 | 0 | 0 | 0 | 8 | 0 | 0 | 0 | 3 | 5 | 0 | 0 |
| 2013 | 0 | 0 | 0 | 0 | 0 | 0 | 3 | 0 | 0 | 0 | 0 | 4 |
| 2014 | 0 | 0 | 0 | 0 | 0 | 0 | 0 | 0 | 0 | 0 | 4 | 0 |
| 2015 | 0 | 0 | 0 | 0 | 0 | 0 | 0 | 1 | 0 | 0 | 0 | 24 |
| 2016 | 1 | 0 | 0 | 0 | 18 | 0 | 0 | 0 | 0 | 1 | 10 | 0 |
| 2017 | 0 | 1 | 53 | 1 | 9 | 8 | 17 | 17 | 9 | 43 | 54 | 17 |
| 2018 | 36 | 19 | 18 | 13 | 0 | 36 | 35 | 71 | 107 | 140 | 18 | 0 |
| 2019 | 35 | 38 | 88 | 195 | 35 | 72 | 0 | 18 | 141 | 132 | 37 | 0 |
| 2020 | 35 | 51 | 18 | 133 | 168 | 81 | 113 | 113 | 109 | 123 | 203 | 141 |
| 2021 | 140 | 143 | 166 | 62 | 146 | 139 | 127 | 131 | 166 | 133 | 117 | 104 |
| 2022 | 53 | 39 | 140 | 79 | 121 | 85 | 46 | 84 | 99 | 82 | 82 | 87 |
| 2023 | 138 | 92 | 88 | 72 | 50 | 55 | 45 | 110 | 106 | 137 | 119 | 115 |
| 2024 | 74 | 113 | 105 | 110 | 103 | 116 | ||||||
| - = No Data Reported; -- = Not Applicable; NA = Not Available; W = Withheld to avoid disclosure of individual company data. |
| Release Date: 8/30/2024 |
| Next Release Date: 9/30/2024 |