|
Download Data (XLS File) |
|
||||||||
|
||||||||
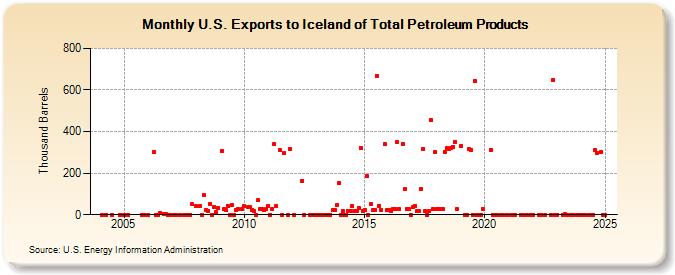
| U.S. Exports to Iceland of Total Petroleum Products (Thousand Barrels) | ||||||||
| Year | Jan | Feb | Mar | Apr | May | Jun | Jul | Aug | Sep | Oct | Nov | Dec |
|---|---|---|---|---|---|---|---|---|---|---|---|---|
| 2004 | 0 | 0 | 1 | 0 | ||||||||
| 2005 | 0 | 0 | 0 | 0 | ||||||||
| 2006 | 0 | 303 | 0 | 0 | 9 | 3 | 3 | 0 | 0 | |||
| 2007 | 0 | 0 | 0 | 0 | 1 | 0 | 0 | 51 | ||||
| 2008 | 42 | 42 | 0 | 93 | 25 | 18 | 53 | 0 | 36 | 11 | 33 | |
| 2009 | 307 | 29 | 21 | 42 | 0 | 49 | 0 | 24 | 27 | 28 | ||
| 2010 | 41 | 35 | 35 | 25 | 17 | 0 | 70 | 28 | 28 | 21 | 28 | |
| 2011 | 44 | 1 | 28 | 338 | 42 | 310 | 1 | 296 | 0 | 315 | ||
| 2012 | 0 | 164 | 0 | 0 | 0 | 0 | ||||||
| 2013 | 0 | 0 | 0 | 0 | 0 | 0 | 0 | 0 | 21 | 22 | 45 | 151 |
| 2014 | 0 | 19 | 0 | 0 | 18 | 19 | 40 | 19 | 20 | 34 | 322 | 19 |
| 2015 | 24 | 184 | 0 | 51 | 21 | 23 | 669 | 42 | 23 | 341 | 23 | |
| 2016 | 23 | 16 | 28 | 28 | 348 | 28 | 341 | 122 | 28 | 28 | 0 | |
| 2017 | 35 | 44 | 17 | 16 | 124 | 316 | 16 | 0 | 16 | 456 | 28 | 300 |
| 2018 | 28 | 28 | 29 | 28 | 302 | 320 | 315 | 322 | 328 | 351 | 28 | |
| 2019 | 332 | 0 | 0 | 315 | 312 | 0 | 645 | 0 | 0 | 0 | 28 | |
| 2020 | 312 | 0 | 0 | 0 | 0 | 0 | 0 | |||||
| 2021 | 0 | 0 | 0 | 0 | 0 | 1 | 0 | |||||
| 2022 | 0 | 0 | 0 | 0 | 0 | 648 | 0 | |||||
| 2023 | 0 | 0 | 2 | 1 | 1 | 0 | 0 | 0 | ||||
| 2024 | 0 | 0 | 0 | |||||||||
| - = No Data Reported; -- = Not Applicable; NA = Not Available; W = Withheld to avoid disclosure of individual company data. |
| Release Date: 6/28/2024 |
| Next Release Date: 7/31/2024 |