|
Download Data (XLS File) |
|
||||||||
|
||||||||
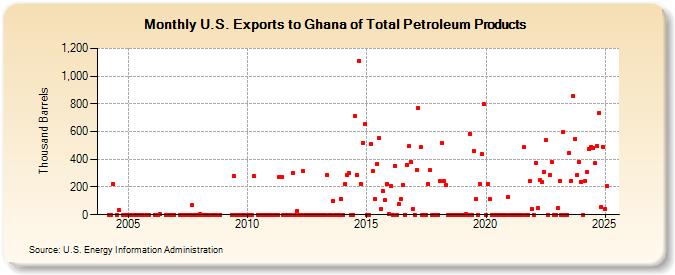
| U.S. Exports to Ghana of Total Petroleum Products (Thousand Barrels) | ||||||||
| Year | Jan | Feb | Mar | Apr | May | Jun | Jul | Aug | Sep | Oct | Nov | Dec |
|---|---|---|---|---|---|---|---|---|---|---|---|---|
| 2004 | 0 | 1 | 225 | 1 | 31 | 0 | 1 | 0 | ||||
| 2005 | 0 | 0 | 1 | 0 | 0 | 0 | 1 | 1 | 0 | |||
| 2006 | 0 | 1 | 0 | 2 | 1 | 1 | 0 | 0 | 1 | |||
| 2007 | 1 | 1 | 1 | 1 | 1 | 1 | 73 | 1 | 1 | 1 | ||
| 2008 | 3 | 0 | 0 | 0 | 0 | 0 | 0 | 0 | 1 | |||
| 2009 | 0 | 281 | 0 | 0 | 0 | 0 | 0 | 0 | ||||
| 2010 | 1 | 0 | 0 | 279 | 0 | 1 | 1 | 1 | 0 | 0 | 0 | |
| 2011 | 1 | 0 | 1 | 0 | 271 | 275 | 1 | 0 | 0 | 0 | 0 | 304 |
| 2012 | 0 | 26 | 0 | 0 | 312 | 1 | 0 | 1 | 0 | 0 | 0 | 0 |
| 2013 | 0 | 0 | 1 | 0 | 287 | 0 | 0 | 97 | 0 | 0 | 0 | 114 |
| 2014 | 0 | 222 | 286 | 302 | 0 | 0 | 713 | 286 | 1,112 | 222 | 520 | 654 |
| 2015 | 0 | 0 | 511 | 312 | 114 | 364 | 551 | 43 | 168 | 103 | 222 | 5 |
| 2016 | 209 | 0 | 355 | 0 | 74 | 112 | 215 | 0 | 361 | 493 | 382 | 40 |
| 2017 | 1 | 326 | 772 | 486 | 0 | 0 | 0 | 222 | 320 | 0 | 0 | 1 |
| 2018 | 1 | 241 | 520 | 242 | 211 | 0 | 0 | 0 | 0 | 0 | 0 | 0 |
| 2019 | 0 | 0 | 2 | 0 | 585 | 0 | 460 | 115 | 0 | 220 | 439 | 796 |
| 2020 | 0 | 221 | 110 | 0 | 1 | 0 | 0 | 0 | 1 | 1 | 1 | 131 |
| 2021 | 0 | 0 | 1 | 0 | 0 | 0 | 0 | 486 | 0 | 1 | 241 | 44 |
| 2022 | 0 | 374 | 47 | 247 | 239 | 310 | 537 | 0 | 285 | 381 | 0 | 0 |
| 2023 | 46 | 243 | 0 | 522 | 1 | 0 | 448 | 244 | 860 | 547 | 289 | 379 |
| 2024 | 239 | |||||||||||
| - = No Data Reported; -- = Not Applicable; NA = Not Available; W = Withheld to avoid disclosure of individual company data. |
| Release Date: 3/29/2024 |
| Next Release Date: 4/30/2024 |