|
Download Data (XLS File) |
|
||||||||
|
||||||||
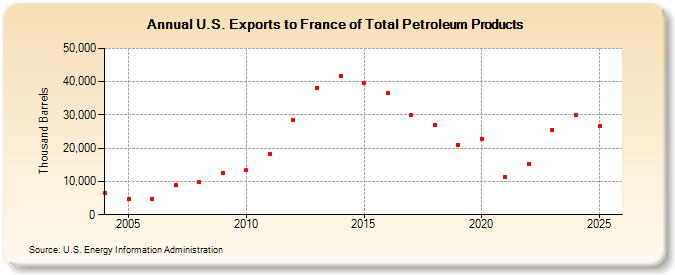
| U.S. Exports to France of Total Petroleum Products (Thousand Barrels) | ||||||||
| Decade | Year-0 | Year-1 | Year-2 | Year-3 | Year-4 | Year-5 | Year-6 | Year-7 | Year-8 | Year-9 |
|---|---|---|---|---|---|---|---|---|---|---|
| 2000's | 6,524 | 4,723 | 4,778 | 8,929 | 9,831 | 12,528 | ||||
| 2010's | 13,317 | 18,139 | 28,444 | 38,222 | 41,590 | 39,698 | 36,466 | 29,870 | 26,838 | 21,101 |
| 2020's | 22,714 | 11,434 | 15,294 | 26,203 |
| - = No Data Reported; -- = Not Applicable; NA = Not Available; W = Withheld to avoid disclosure of individual company data. |
| Release Date: 6/28/2024 |
| Next Release Date: 8/30/2024 |